On my ongoing quest for new inspirations I bought Laurens Bensdorp’s book „Automated Stock Trading Systems“

In the first half of his book he talks about his rich experience as a trader and teacher and the psychological aspects of trading. He details the mindset necessary to be a successful trader and explains all the interesting things that happen if a trader’s expectations, phantasies, wishes and hopes collide with real-time reality.
In the second half he presents and explains the wonders of diversification. For Bensdorp diversification is not (only) about a large watch list/portfolio/DataSet of stocks but also and foremost about a portfolio of uncorrelated trading systems. In order to illustrate his ideas he presents seven trading systems in great detail.
Out of curiosity and to test the current power and abilities of Wealth-Lab I implemented and published (my personal interpretation of) these trading systems:
Bensdorp's Short Rsi Thrust
https://www.wealth-lab.com/Strategy/DesignPublished?strategyID=48
Bensdorp's Short Mean reversion High Six-Day Surge
https://www.wealth-lab.com/Strategy/DesignPublished?strategyID=47
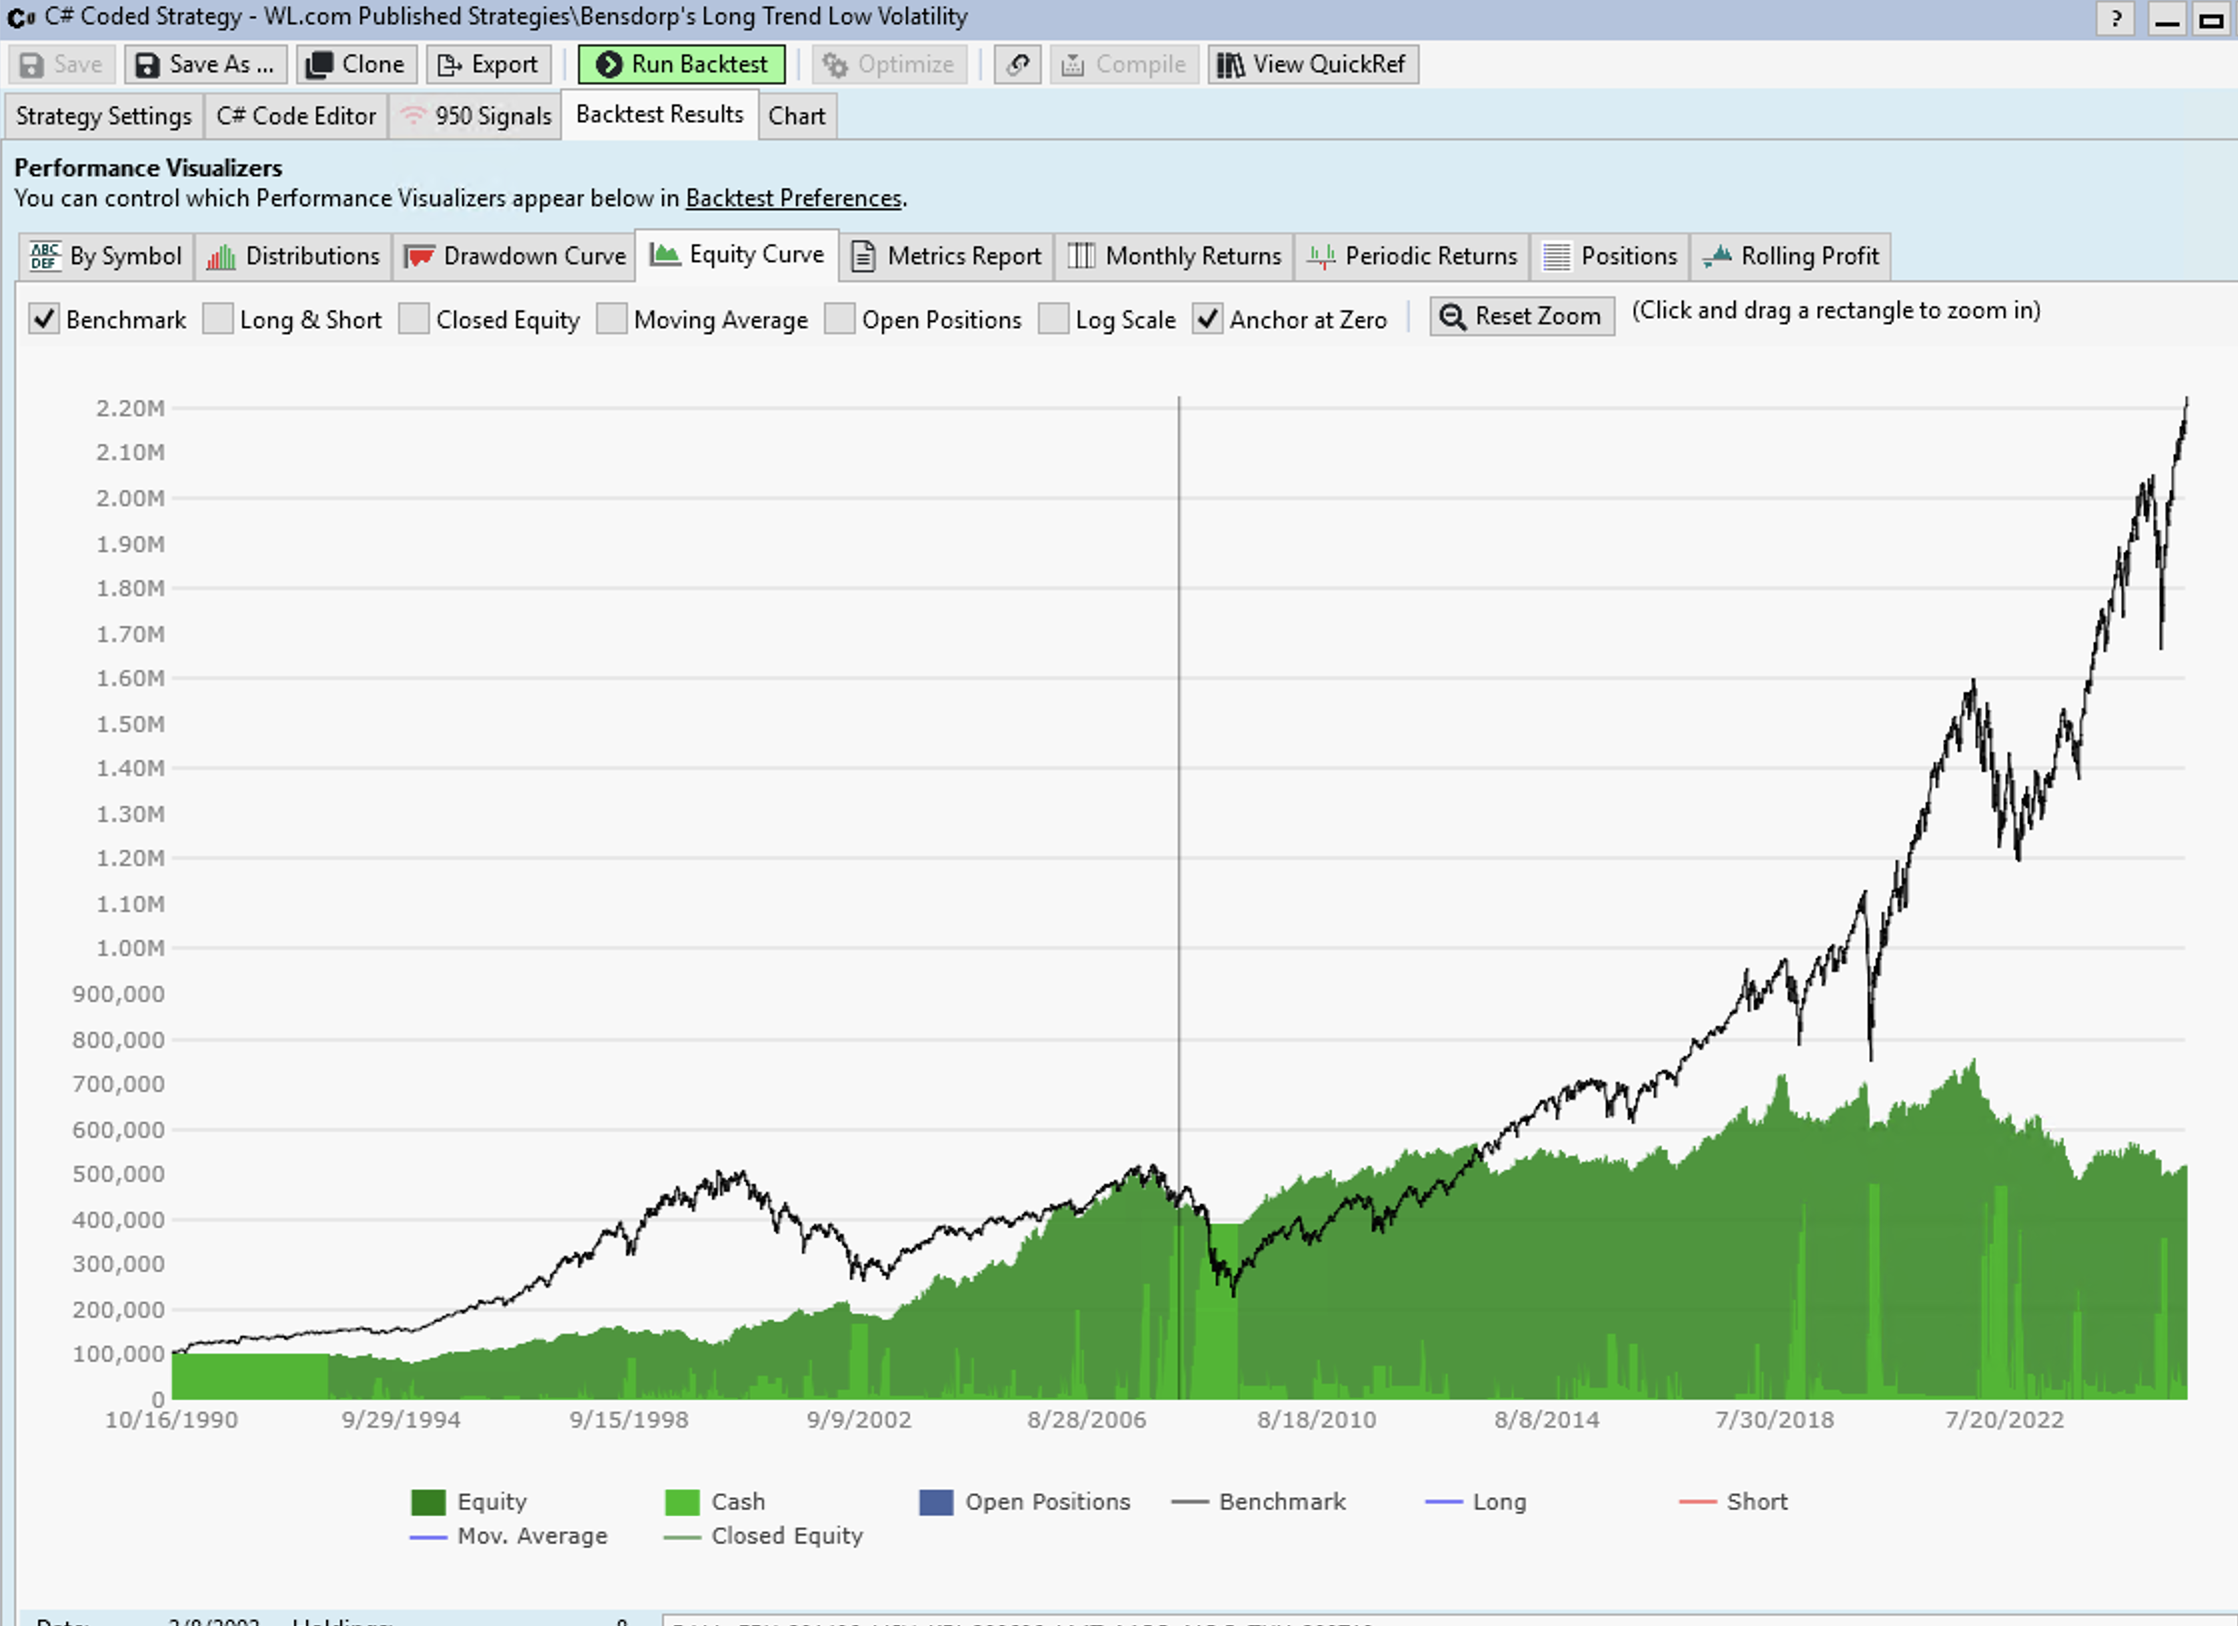
Bensdorp's Long Trend Low Volatility
https://www.wealth-lab.com/Strategy/DesignPublished?strategyID=46
Bensdorp's Long Trend High Momentum
https://www.wealth-lab.com/Strategy/DesignPublished?strategyID=45
Bensdorp's Long Mean Reversion Selloff
https://www.wealth-lab.com/Strategy/DesignPublished?strategyID=44
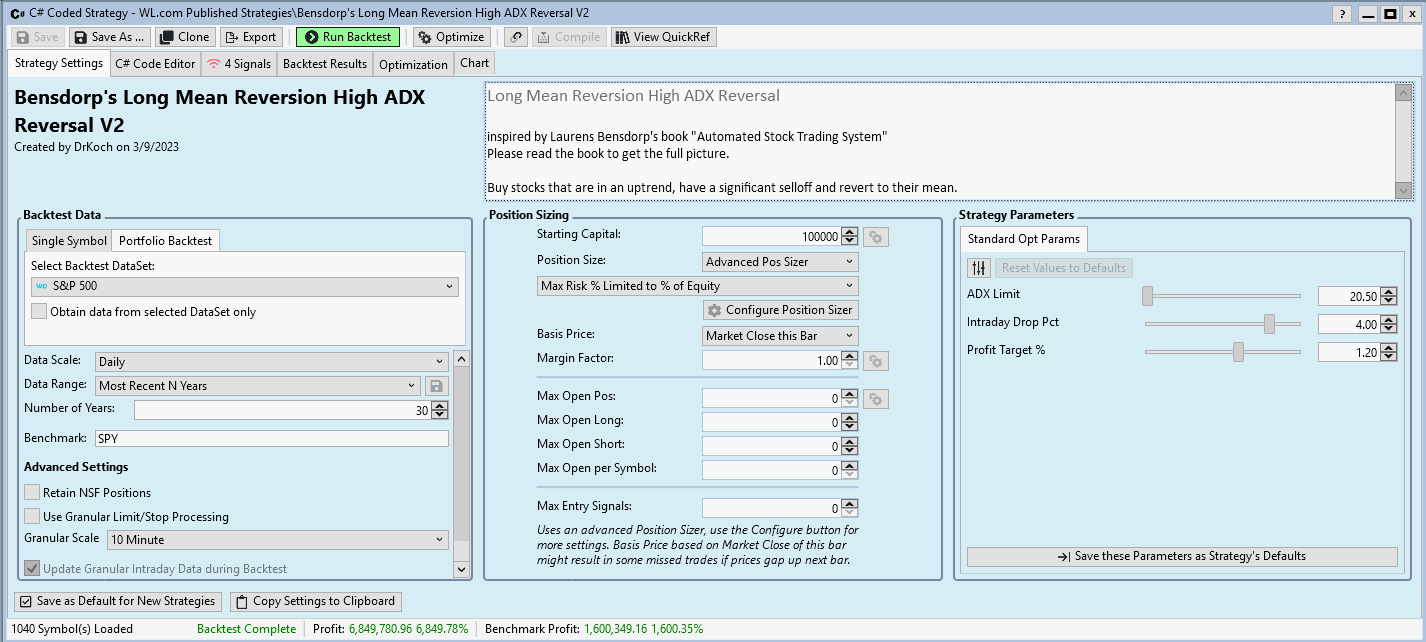
Bensdorp's Long Mean Reversion High ADX Reversal
https://www.wealth-lab.com/Strategy/DesignPublished?strategyID=43
Bensdorp's Catastrophe Hedge
https://www.wealth-lab.com/Strategy/DesignPublished?strategyID=42
These are real world trading system, complete with the following parts:
Filters
Filters are used to remove stocks with low volume and low prices (penny stocks).
Differentiators
A condition which helps to make a trading strategy uncorrelated form other trading strategies
Setups
This are conditions the price series must fulfill in order to be considered a trading candidate.
Entries
Market or Limit orders along with limit price calculations
Weighting / Ranking
If there are more candidates than available capital then entry orders are issued for stocks with the highest weighting only.
Exits
A complete set of exit orders:
• Stop Loss
• Profit Taking
• Time based exits / Timeouts
In the first half of his book he talks about his rich experience as a trader and teacher and the psychological aspects of trading. He details the mindset necessary to be a successful trader and explains all the interesting things that happen if a trader’s expectations, phantasies, wishes and hopes collide with real-time reality.
In the second half he presents and explains the wonders of diversification. For Bensdorp diversification is not (only) about a large watch list/portfolio/DataSet of stocks but also and foremost about a portfolio of uncorrelated trading systems. In order to illustrate his ideas he presents seven trading systems in great detail.
Out of curiosity and to test the current power and abilities of Wealth-Lab I implemented and published (my personal interpretation of) these trading systems:
Bensdorp's Short Rsi Thrust
https://www.wealth-lab.com/Strategy/DesignPublished?strategyID=48
Bensdorp's Short Mean reversion High Six-Day Surge
https://www.wealth-lab.com/Strategy/DesignPublished?strategyID=47
Bensdorp's Long Trend Low Volatility
https://www.wealth-lab.com/Strategy/DesignPublished?strategyID=46
Bensdorp's Long Trend High Momentum
https://www.wealth-lab.com/Strategy/DesignPublished?strategyID=45
Bensdorp's Long Mean Reversion Selloff
https://www.wealth-lab.com/Strategy/DesignPublished?strategyID=44
Bensdorp's Long Mean Reversion High ADX Reversal
https://www.wealth-lab.com/Strategy/DesignPublished?strategyID=43
Bensdorp's Catastrophe Hedge
https://www.wealth-lab.com/Strategy/DesignPublished?strategyID=42
These are real world trading system, complete with the following parts:
Filters
Filters are used to remove stocks with low volume and low prices (penny stocks).
Differentiators
A condition which helps to make a trading strategy uncorrelated form other trading strategies
Setups
This are conditions the price series must fulfill in order to be considered a trading candidate.
Entries
Market or Limit orders along with limit price calculations
Weighting / Ranking
If there are more candidates than available capital then entry orders are issued for stocks with the highest weighting only.
Exits
A complete set of exit orders:
• Stop Loss
• Profit Taking
• Time based exits / Timeouts
Rename
Thanks for the effort!
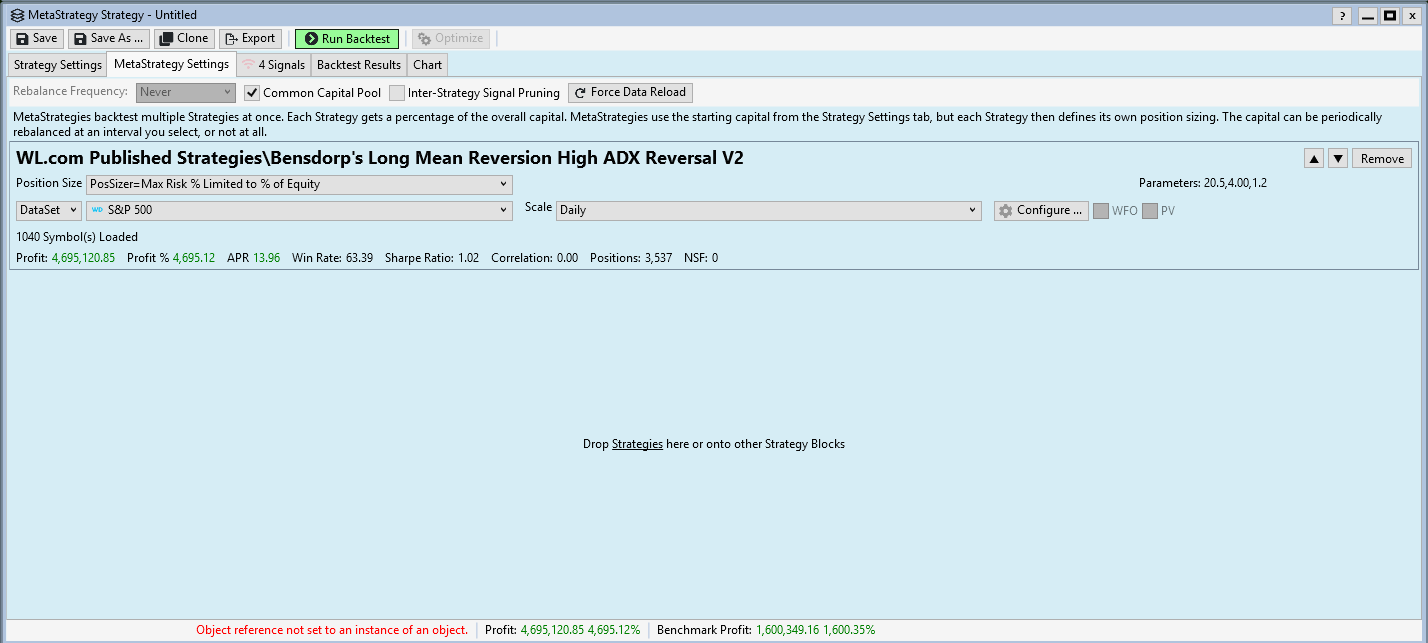
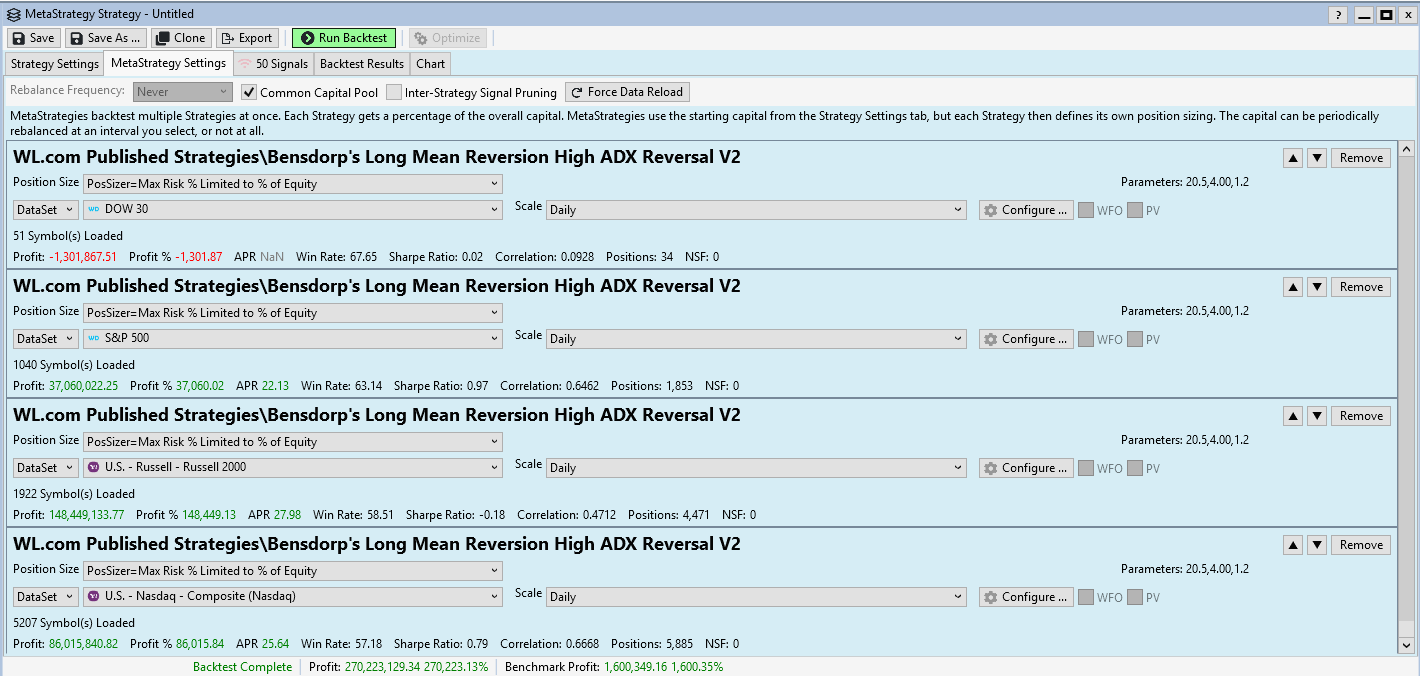
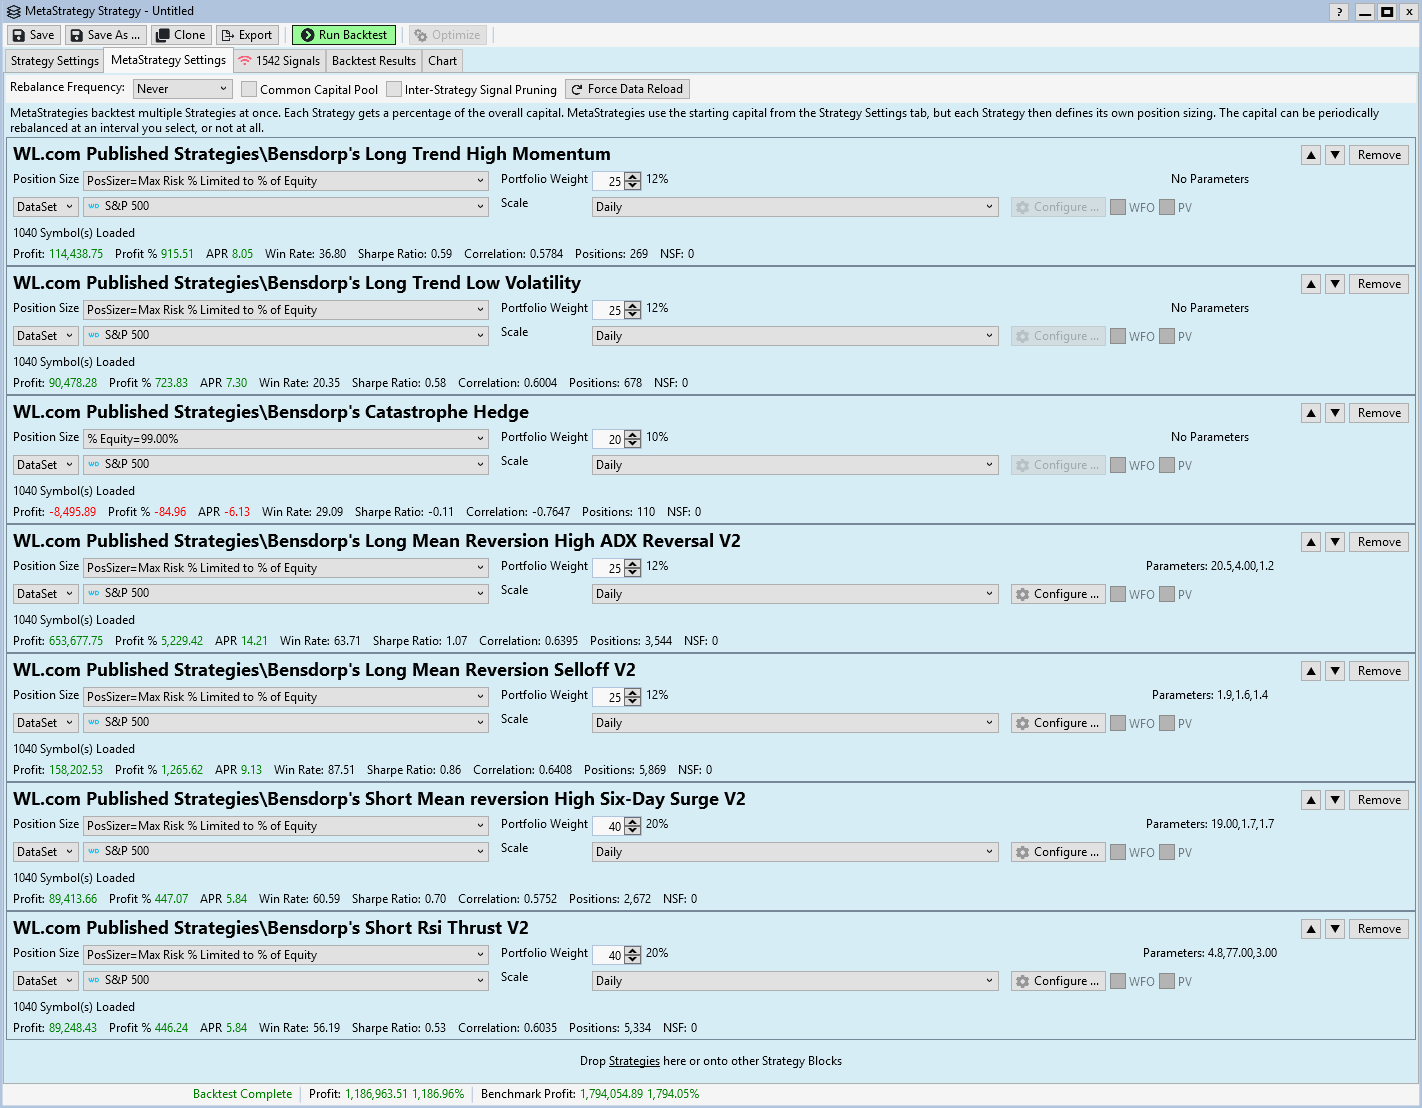
It is possible to combine all these seven systems in a WL Meta Strategy:

And the results are stunning. Here the equity curve:

WL can produce the equity curves of all combined systems in a single graph:

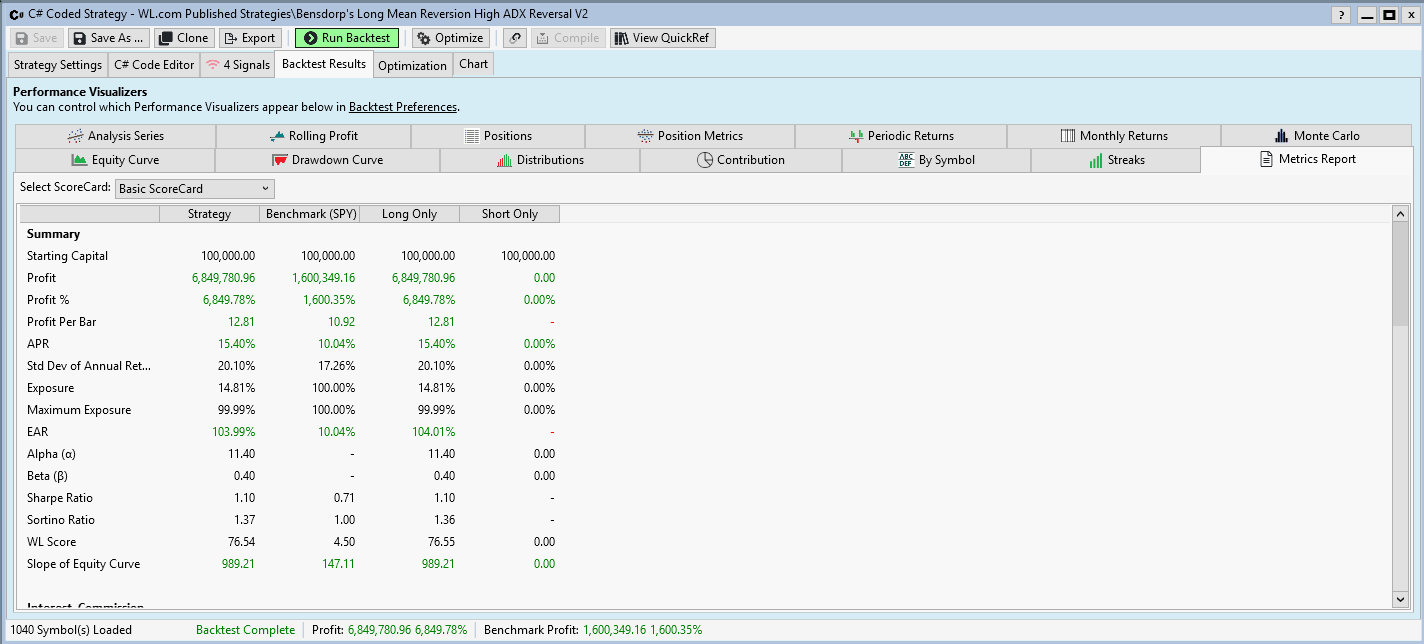
And finally a summary of metrics:

And the results are stunning. Here the equity curve:
WL can produce the equity curves of all combined systems in a single graph:
And finally a summary of metrics:
Looks like we need a new TASC article feature these findings!
In the book Laurens Bensdrop has two different informations about the Watchlist/Portfolio/DataSet he is using.
On page 53 he talks about 40'000 stocks, half of them delisted.
On page 172 He says "The US markets have a tradeable universe of approximately 7000 stocks to work with"
Both numbers are a bit out of reach as long as you don't have an expensive data provider (like Norgate or IQFeed).
So I adapted the parameters using the SMAC optimizer and the methods mentioned in the "How to address overfitting" forum thread (https://www.wealth-lab.com/Discussion/How-to-address-overfitting-9305) to work for the WealthSignals portfolio (738 symbols).
I learned a few things during the journey:
1. A single system needs not to be good all the time. Diversification is the key.
2. The effect of diversification is much larger than I expected.
3. If you are looking for (more or less) extreme trading opportunities, the size of your DataSet makes a huge difference.
1. A single system needs not to be good all the time. Diversification is the key.
2. The effect of diversification is much larger than I expected.
3. If you are looking for (more or less) extreme trading opportunities, the size of your DataSet makes a huge difference.
Oh, I forgot to mention:
Looking at all the results in this thread one thing becomes clear: Wealth-Lab is a GREAT SOFTWARE PACKAGE!
Looking at all the results in this thread one thing becomes clear: Wealth-Lab is a GREAT SOFTWARE PACKAGE!
Here are the system correlations:

Thank you very much DrKoch for sharing the results of your hard work.
This one is a gem that deserves to be pinned to the top, for a long while!
A couple of weeks ago, I saw the reference to this book in another post, in this Forum; and I just started reading it last weekend. The book doesn't come up with much new, but it is an eye opener how the combination of a set of uncorrelated average systems results in a robust market-beating meta-strategy. Simple really is better, most of the times. Very underrated book (at least, I never saw it referenced until very recently).
Again: thanks for sharing!!
I just let the MetaStrategy run again with the Out-of-Sample Interval 2022-today included:
(I never used this data for Bensdorp's systems before)

... very reassuring!
(I never used this data for Bensdorp's systems before)
... very reassuring!
From the profit curves (equity curves of individual systems in the MetaStrategy) it becomes obvious how diversification worked at its best during the two last difficult years:

Thank you for your efforts. The results are impressive, I'll try to replicate this. I'm definitely doing something wrong, as I haven't managed to beat the market even on history yet. Even with the strategies already published here.
I contacted My Bensdorp on LinkedIn to let him know about this implementation. Maybe he'll become an avid WealthLab supporter! :D
How can AvgTurnover from finantic.Indicators be replaced in these scripts?
If it’s name is accurate it could be an SMA of the Turnover indicator.
The Turnover here in these scripts is just a filter to ensure that there's enough trading happening (i.e. avoid illiquid stocks)
If your data doesn't have Turnover available, then using Close * Volume as the turnover figure should approximate the turnover.
If your data doesn't have Turnover available, then using Close * Volume as the turnover figure should approximate the turnover.
Our built-in Turnover Indicator is already a shortcut for the Close * Volume.
Changed avgTurnover to "new SMA(new Turnover(bars),20);"
the rest are default settings, without margin. Got the following picture, which is different from the one here

The only difference in settings I see is PosSizer absence in my case, since I haven't found exactly like that. Where am I wrong?
the rest are default settings, without margin. Got the following picture, which is different from the one here
The only difference in settings I see is PosSizer absence in my case, since I haven't found exactly like that. Where am I wrong?
QUOTE:
How can AvgTurnover from finantic.Indicators be replaced in these scripts?
The correct answer is: You should not replace it! Buy the finatic.Indicators extension instead.
You ask "why should I"?
Let me explain:
What you see here (the seven Bensdorp strategies implemented for WL8) is the result of many hours of hard work partly on Mr. Bensdorps' side, partly on my side.
Based on many years of experience with WL. Based on many hours of experimenting.
If you look through the code you could see literally decades of programing experience.
And true: I built in three small mechanisms of compensation. And instead of asking yourself how you can go around this mechanisms you should:
* Buy the book and read it
* buy as many finantic extensions as you can (You'll need them in going forward anyway)
* think about giving back in various other ways like sharing your results on the forum or donate some money.
I can assure you: If you try to make things as cheap as possible for you you'll be never able to replicate the results shown in this thread or even improve on them.
All strategies use limit orders. But at the same time, tests are weighted - positions with the highest weight are opened. Isn't this a peek into the future?
There's a Strategy error (oversight) in "Catastophe Hedge". Line 48 checks to see if a Long Position is active to limit the strategy to one position per symbol, but instead it should be checking for an open Short Position.
I can probably correct the public strategy, but if you already downloaded, you'll have to make the change on your local machine. Or are these refreshed/downloaded with each restart?
I can probably correct the public strategy, but if you already downloaded, you'll have to make the change on your local machine. Or are these refreshed/downloaded with each restart?
Corrected.
The strategy will be automatically corrected by restarting WealthLab (with a connection).
The strategy will be automatically corrected by restarting WealthLab (with a connection).
>> All strategies use limit orders. But at the same time, tests are weighted - positions with the highest weight are opened. Isn't this a peek into the future?<<
In a way yes, it’s causing the backtest to choose orders that might not have actually been the ones that would have filled first in live trading. A deterministic approach would limit the number of entries to ensure only a specific number would fill to meet the equity.
For this reason I prefer to use Weights only for market orders, where the results are deterministic. Or if I must use limit orders I sort by the Weights in PreExecute and only place an appropriate number of orders that I know will fill.
I vote we remove the Weights for published strategies using limit orders for more realistic results. You could then use our Monte Carlo Lab extension to get a true idea of their potential.
I've referred to Laurens Bensdorp's a few weeks ago during an non-market-correlation discussion.
https://www.wealth-lab.com/Discussion/How-to-leave-only-strategies-with-smooth-equity-curve-9302
His approach to follow a non-correlated approach (with up to 50 different strategies) impressed me pretty much at that time. I came across him via an interview with Tom Basso. The only thing that made me a bit skeptical was his choice of Universe, which according to the book consists of NYSE + ARCA + NASDAQ stocks (survivorship bias free).
From what I know, he's also a big believer in rotational strategies, which could mean he could feel comfortable in WL.
Nevertheless, "Dankeschön" to Mr. Koch for the effort he put into his WL dev work. I had this on my radar last year, but unfortunately had to push it out to 2023.
Where might I find the "WealthSignals" portfolio?
Thanks..
I don't see the 783 symbols that Dr Koch was referring to..
I don't see the 783 symbols that Dr Koch was referring to..
I don't see how to replicate Dr Koch's Position Sizers. ""Max Risk Limited" Do these require a special extension?
I totally agree that diversification is the key.
QUOTE:
I don't see the 783 symbols that Dr Koch was referring to..
https://www.wealthsignals.com/symbol-list
QUOTE:
I don't see how to replicate Dr Koch's Position Sizers. ""Max Risk Limited" Do these require a special extension?
This will be included in the next build of finantic.Indicators.
>https://www.wealthsignals.com/symbol-list
Wouldn't this set lead us to the survivorship bias? Or the key is "Max Risk Limited" sizer?
Wouldn't this set lead us to the survivorship bias? Or the key is "Max Risk Limited" sizer?
Yes, any current symbol list inherently leads to survivorship bias. Use one of the Wealth-Data DataSets (like the S&P 500) to eliminate the bias, or one of many of those offered by Norgate Data.
fyi, WealthSignals stocks are the current symbols in the S&P 500, Nasdaq 100, selected highly liquid ETFs, and a handful of stocks that some users requested to trade.
fyi, WealthSignals stocks are the current symbols in the S&P 500, Nasdaq 100, selected highly liquid ETFs, and a handful of stocks that some users requested to trade.
Thanks to Eugene and Dr Koch
Given the liquidity (turnover) constraints in these systems, you could use the Russell 3000 (Current & Past) which goes back to 1990 with no survivorship bias with Norgate Data.
There wouldn't be many qualifying (or statistically significant) trades beyond that.
Cheers,
Richard.
There wouldn't be many qualifying (or statistically significant) trades beyond that.
Cheers,
Richard.
Tested a meta-strategy of seven strategies on the SP500 (WealthData). 14% for each strategy. Yearly Rebalance. Comission 0.05% tradeValue.
Result: 8-9% APR, drawdown -10%. Not too much :)
I could not test it on Russell 3000 CurrentAndPast(NorgateData), because apparently my computer is not powerful enough and the WL8 freezes.


Result: 8-9% APR, drawdown -10%. Not too much :)
I could not test it on Russell 3000 CurrentAndPast(NorgateData), because apparently my computer is not powerful enough and the WL8 freezes.
You’ll probably need more RAM when testing the Russel 3000, I have 64gig
and can backtest it without issue.
Also it looks like you might bump up the position sizes?
and can backtest it without issue.
Also it looks like you might bump up the position sizes?
"You’ll probably need more RAM when testing the Russel 3000, I have 64gig"
Yes, I only have 32 gig
"Also it looks like you might bump up the position sizes?"
It's probably possible. Exposure is only 36%
Yes, I only have 32 gig
"Also it looks like you might bump up the position sizes?"
It's probably possible. Exposure is only 36%
Anyone care to share what they find to be a realistic average turnover to use in back testing? Cesar Alvarez mentioned that he used a 21 day average of $5 million when testing low volume stocks.
Sounds like a good idea, it seems to combine the volume and the stock price.
The first version of these scripts implemented ranking and limiting the number of positions with a transaction weight and a "Max Open Pos" setting in Strategy Setting->Positio Sizing.
This raised some (justified) concerns beause both cause some subtle form of peeking into the future.
As a consequence the weighting was removed form the published scripts.
This makes backtest results highly variable because on busy days positions are choosen randomly by WL. Furthermore a system with many limit orders is hard to trade without additional software or manual intraday interventions.
In order to remedy concerns and difficulties I implemented a ranking mechanism for the Bensdrop strategies:
Daily candidates are renked and only orders with high priorites are issued.
To find a good number of orders to send it usefull to know how many of the ordes sent will be filled. This impossible to know pof course but it is possible to estimate the fill probability form the past.
I implemented a "Fill Probability Estimator" to do this job.
Here is a comparison of two strategies, first with weight and without weights, second with ranking:

Columns B and D show the original strategy with weight. B is the original weight, C is weight * (-1). It becomes clear that this weight has just a small effect: APR 33.6% vs. 30.7%.
Column C shows the current Strategy with weighting removed. This is just one example. If run several times you'll find results which are somewhere between B and D because WL chooses the trades randomly.
Column A shows the results of the new version 2 of the strategy. This works with the new ranking mechanism. It has slightly less trades, which results in lower APR but also in lower Max.Drawdown.
This comparison shows that ranking is not much worse than the (illegal) weighting.
This raised some (justified) concerns beause both cause some subtle form of peeking into the future.
As a consequence the weighting was removed form the published scripts.
This makes backtest results highly variable because on busy days positions are choosen randomly by WL. Furthermore a system with many limit orders is hard to trade without additional software or manual intraday interventions.
In order to remedy concerns and difficulties I implemented a ranking mechanism for the Bensdrop strategies:
Daily candidates are renked and only orders with high priorites are issued.
To find a good number of orders to send it usefull to know how many of the ordes sent will be filled. This impossible to know pof course but it is possible to estimate the fill probability form the past.
I implemented a "Fill Probability Estimator" to do this job.
Here is a comparison of two strategies, first with weight and without weights, second with ranking:
Columns B and D show the original strategy with weight. B is the original weight, C is weight * (-1). It becomes clear that this weight has just a small effect: APR 33.6% vs. 30.7%.
Column C shows the current Strategy with weighting removed. This is just one example. If run several times you'll find results which are somewhere between B and D because WL chooses the trades randomly.
Column A shows the results of the new version 2 of the strategy. This works with the new ranking mechanism. It has slightly less trades, which results in lower APR but also in lower Max.Drawdown.
This comparison shows that ranking is not much worse than the (illegal) weighting.
I equipped all Bensdorp Strategies with limit entries with the new ranking mechanics and published the scripts with a "V2" it their name.
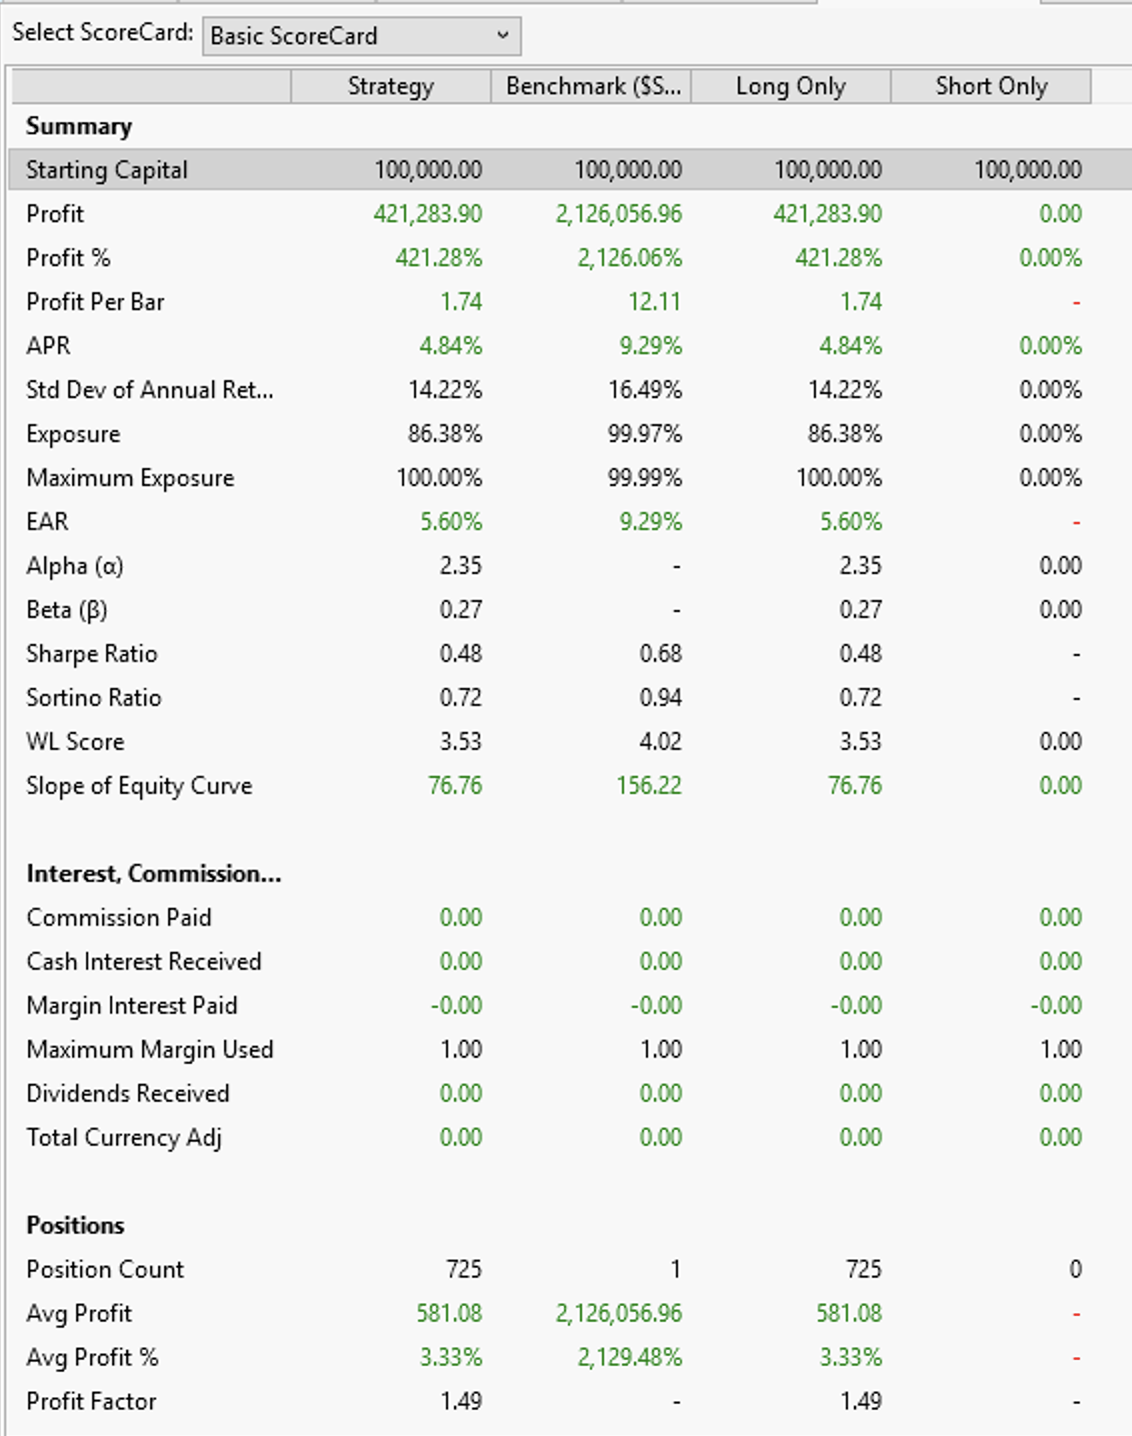
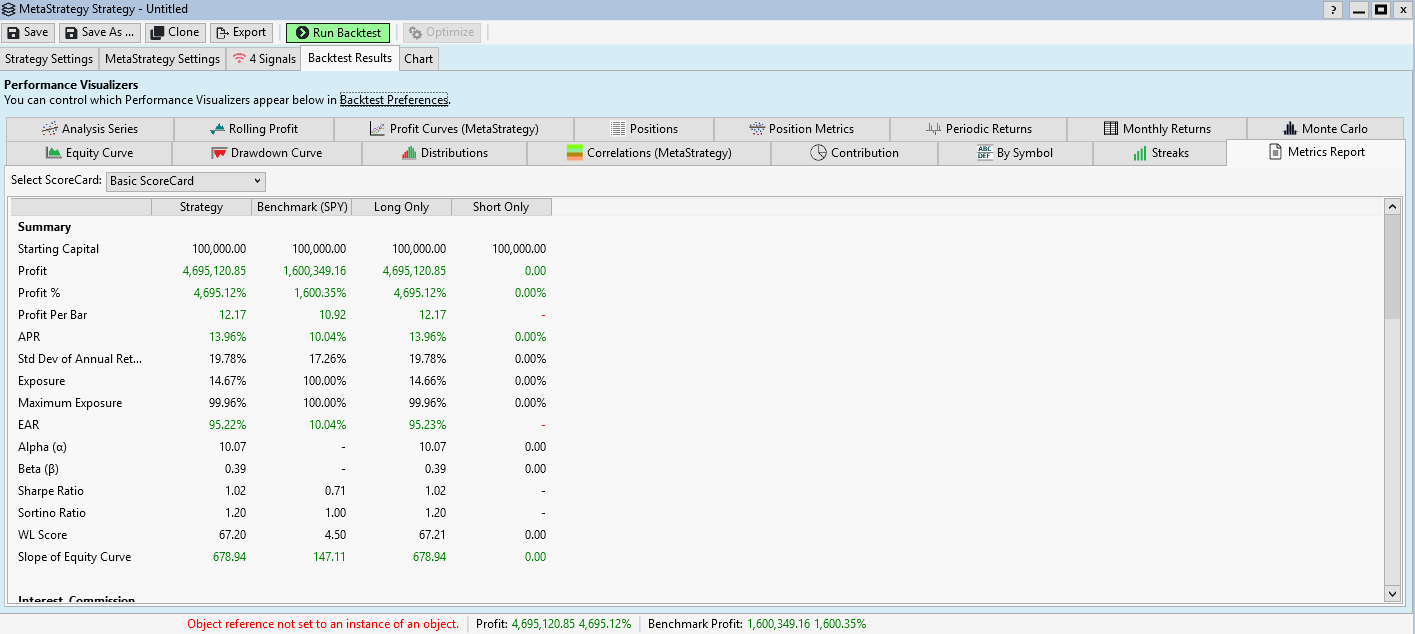
The Gesamtkunstwerk ("total work of art") now looks like this:

The results are as stunning as before:

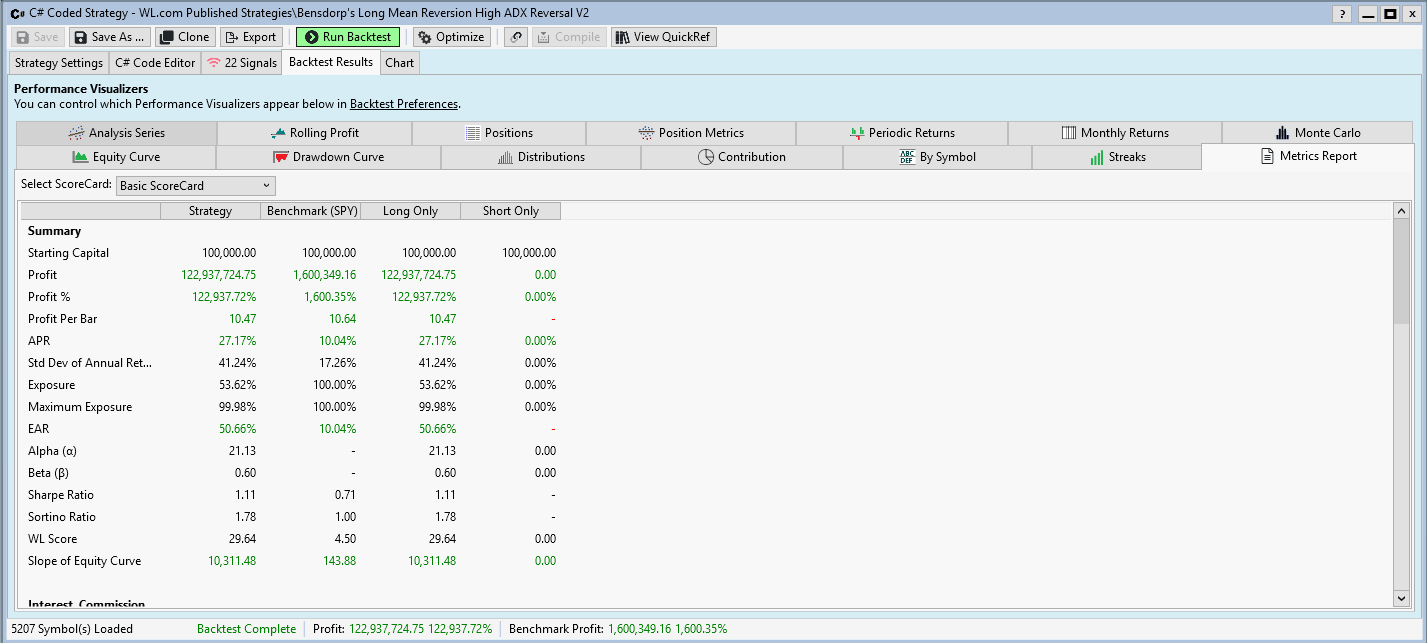
Metrics Report (Favourite Scorecard):

The Gesamtkunstwerk ("total work of art") now looks like this:
The results are as stunning as before:
Metrics Report (Favourite Scorecard):
This should now be very close to the specs in the book. The main difference being the DataSet. All results here are produced with "WealthSignals" DataSet (738 symbols, listed only) while the book is based on "All stocks traded at NYSE, NASDAQ and AMEX, listed and delisted".
Interesting, I wonder if the author was able to do a true survivorship bias test by considering the period symbols were in the index, or just used all symbols,
listed and delisted.
listed and delisted.
@Glitch
At least that's what he wrote in his book. Since he's aware of the survivorship bias issue using such a long period, I would assume that he has taken this into account.

At least that's what he wrote in his book. Since he's aware of the survivorship bias issue using such a long period, I would assume that he has taken this into account.
I am trying to replicate Dr. Koch's results. When I was looking at the MetaStrategy I had some observations that I was hoping you can clear up.
I understand the WealthSignals portfolio is 738 symbols.
How does Portfolio weight choose which symbols because that many symbols is too many to trade constantly? So if I choose a 2% of equity, I still could not trade all the symbols without having NSF?
Also, why choose a Portfolio weight greater than 100% when you add up the 7 strategies in the MetaStrategy.
Here is the snippet I am looking at:

For me, if I had 7 strategies, then the weight should be considering how many strategies and how many assets in each DataSet portfolio.
So for my simplistic example. I have a portfolio of 10 assets.
Each of the 7 strategies would add up to a total of 100%. So I would make each strategy 14% Portfolio weight.
Not sure how, Wealthlab takes it's symbols when the true portfolio is 738 assets. I assume, that I would get NSF. Also, probably, would get different results when I run the test over and over again.
Thank you for your time.
Larry
I understand the WealthSignals portfolio is 738 symbols.
How does Portfolio weight choose which symbols because that many symbols is too many to trade constantly? So if I choose a 2% of equity, I still could not trade all the symbols without having NSF?
Also, why choose a Portfolio weight greater than 100% when you add up the 7 strategies in the MetaStrategy.
Here is the snippet I am looking at:
For me, if I had 7 strategies, then the weight should be considering how many strategies and how many assets in each DataSet portfolio.
So for my simplistic example. I have a portfolio of 10 assets.
Each of the 7 strategies would add up to a total of 100%. So I would make each strategy 14% Portfolio weight.
Not sure how, Wealthlab takes it's symbols when the true portfolio is 738 assets. I assume, that I would get NSF. Also, probably, would get different results when I run the test over and over again.
Thank you for your time.
Larry
The % allocation is displayed next to the "Weight".
In other words, you can put the "weight" at 100 for all of them. That makes them equal "weight". Likewise, the % allocations will all be equal, but the % allocations will add to 100%.
In other words, you can put the "weight" at 100 for all of them. That makes them equal "weight". Likewise, the % allocations will all be equal, but the % allocations will add to 100%.
Cone,
Thank you,
Larry
Thank you,
Larry
Dr. Koch and forum members,
Just wanted to say thank you for this thread. I learned a lot and appreciate the time and effort of all the work that was done.
Much appreciated.
Larry
Just wanted to say thank you for this thread. I learned a lot and appreciate the time and effort of all the work that was done.
Much appreciated.
Larry
Yes thank you DrKoch and others. Very gratifying to see some interesting research published on WL.com!
In the meantime, I finished reading the book last weekend: very easy to read!
Although the concepts are simple and the systems explained don’t bring much new; it really is an eye opener in regards to the power of trading a set on uncorrelated strategies! I knew that diversifications of trading systems was the way to go; but was not aware of how powerful it really is…
Very well worth the time and the cost (not only it is cheap, but the proceedings seem to be going for charity).
One other small correction relative to the book is for the Long Trend Low Volatility the SPY Sma should be 200 not 100.
P.S. Thanks Dr. Koch for publishing this. We should all try to do the same for books we read to help out the community.
P.S. Thanks Dr. Koch for publishing this. We should all try to do the same for books we read to help out the community.
@DrKoch, can I ask why is the below code used in the Long Trend High Momentum strategy even though you have already set a stop loss at 5*20D ATR from the entry price in the 1st half of the code?
CODE:
public override double GetMaxRiskStopLevel(BarHistory bars, PositionType pt, int idx)
      {
         double stop = bars.Close[idx] - 5.0 * atr20[idx];
         return stop;
      }
These are two completely different things:
1. Exit a Position with a stop loss like this:
2. Defining a GetMaxRiskStopLevel() routine.
The latter is (exclusively) used by the Position Sizing method "Max Risk Percent" and related position sizers like Advanced Pos Sizer->Max Risk % Limited to % of Equity.
The existence of a Routine GetMaxRiskStopLevel() does not close any Positions.
See Help->Strategy->Strategy Settings->Max Risk Percent for further details.
1. Exit a Position with a stop loss like this:
CODE:
// Stop Loss
ClosePosition(p, OrderType.Stop, p.EntryPrice - 5.0 * atr20[p.EntryBar], "Stop Loss");
2. Defining a GetMaxRiskStopLevel() routine.
The latter is (exclusively) used by the Position Sizing method "Max Risk Percent" and related position sizers like Advanced Pos Sizer->Max Risk % Limited to % of Equity.
The existence of a Routine GetMaxRiskStopLevel() does not close any Positions.
See Help->Strategy->Strategy Settings->Max Risk Percent for further details.
Hi DrKoch,
Thank you for providing your reply and for putting in the effort in writing the codes.
It seems that The Long Trend High Momentum strategy is using the position sizing method, "Percent of Equity", in Strategy Settings as default. In this case, wouldn't defining the GetMaxRiskStopLevel in the code be redundant since GetMaxRiskStopLevel is used only when "Max Risk Percent" or "Advanced Pos Sizer" is used? Or was GetMaxRiskStopLevel written so as to faciliate users who wish to switch from "Percent of Equity" to "Max Risk Percent"?
Furthermore, can I kindly ask where in the code sets the 2% Risk level per trade? I can only see it mentioned as a comment on line 14.
I have attached the Position Sizing settings that I am using for your reference.
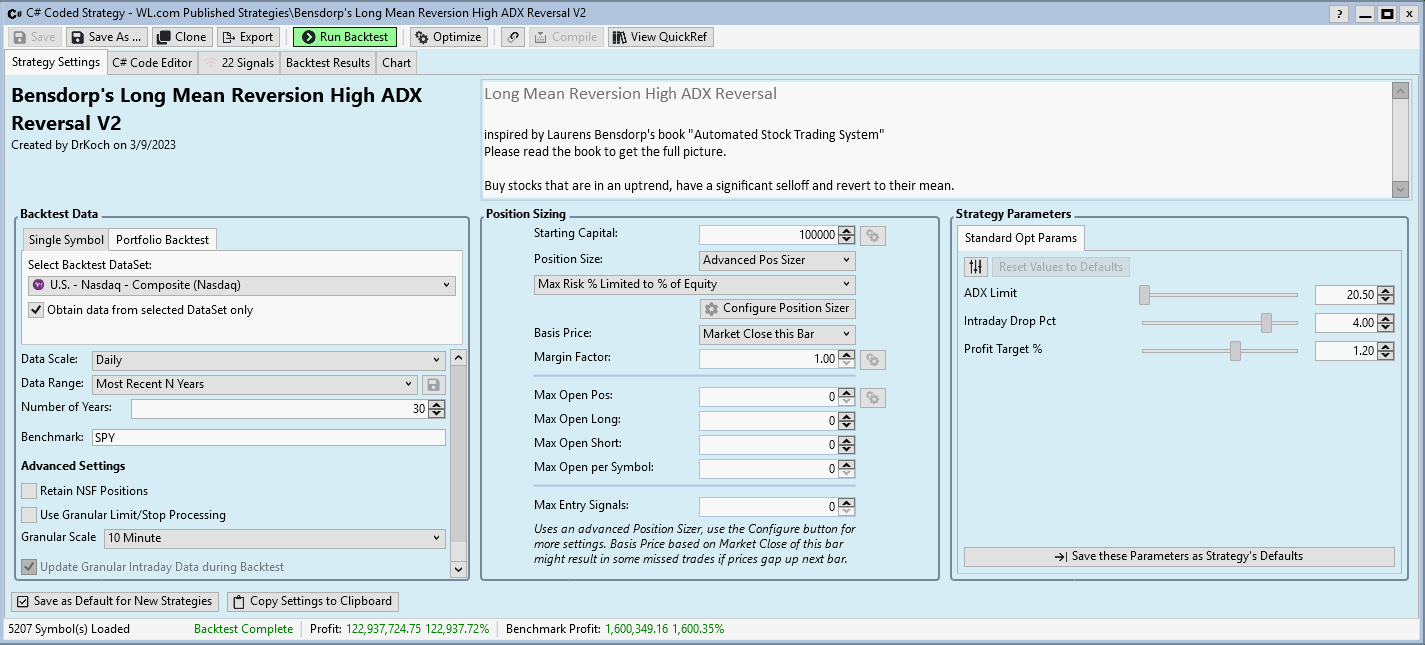
QUOTE:
is using the position sizing method, "Percent of Equity"
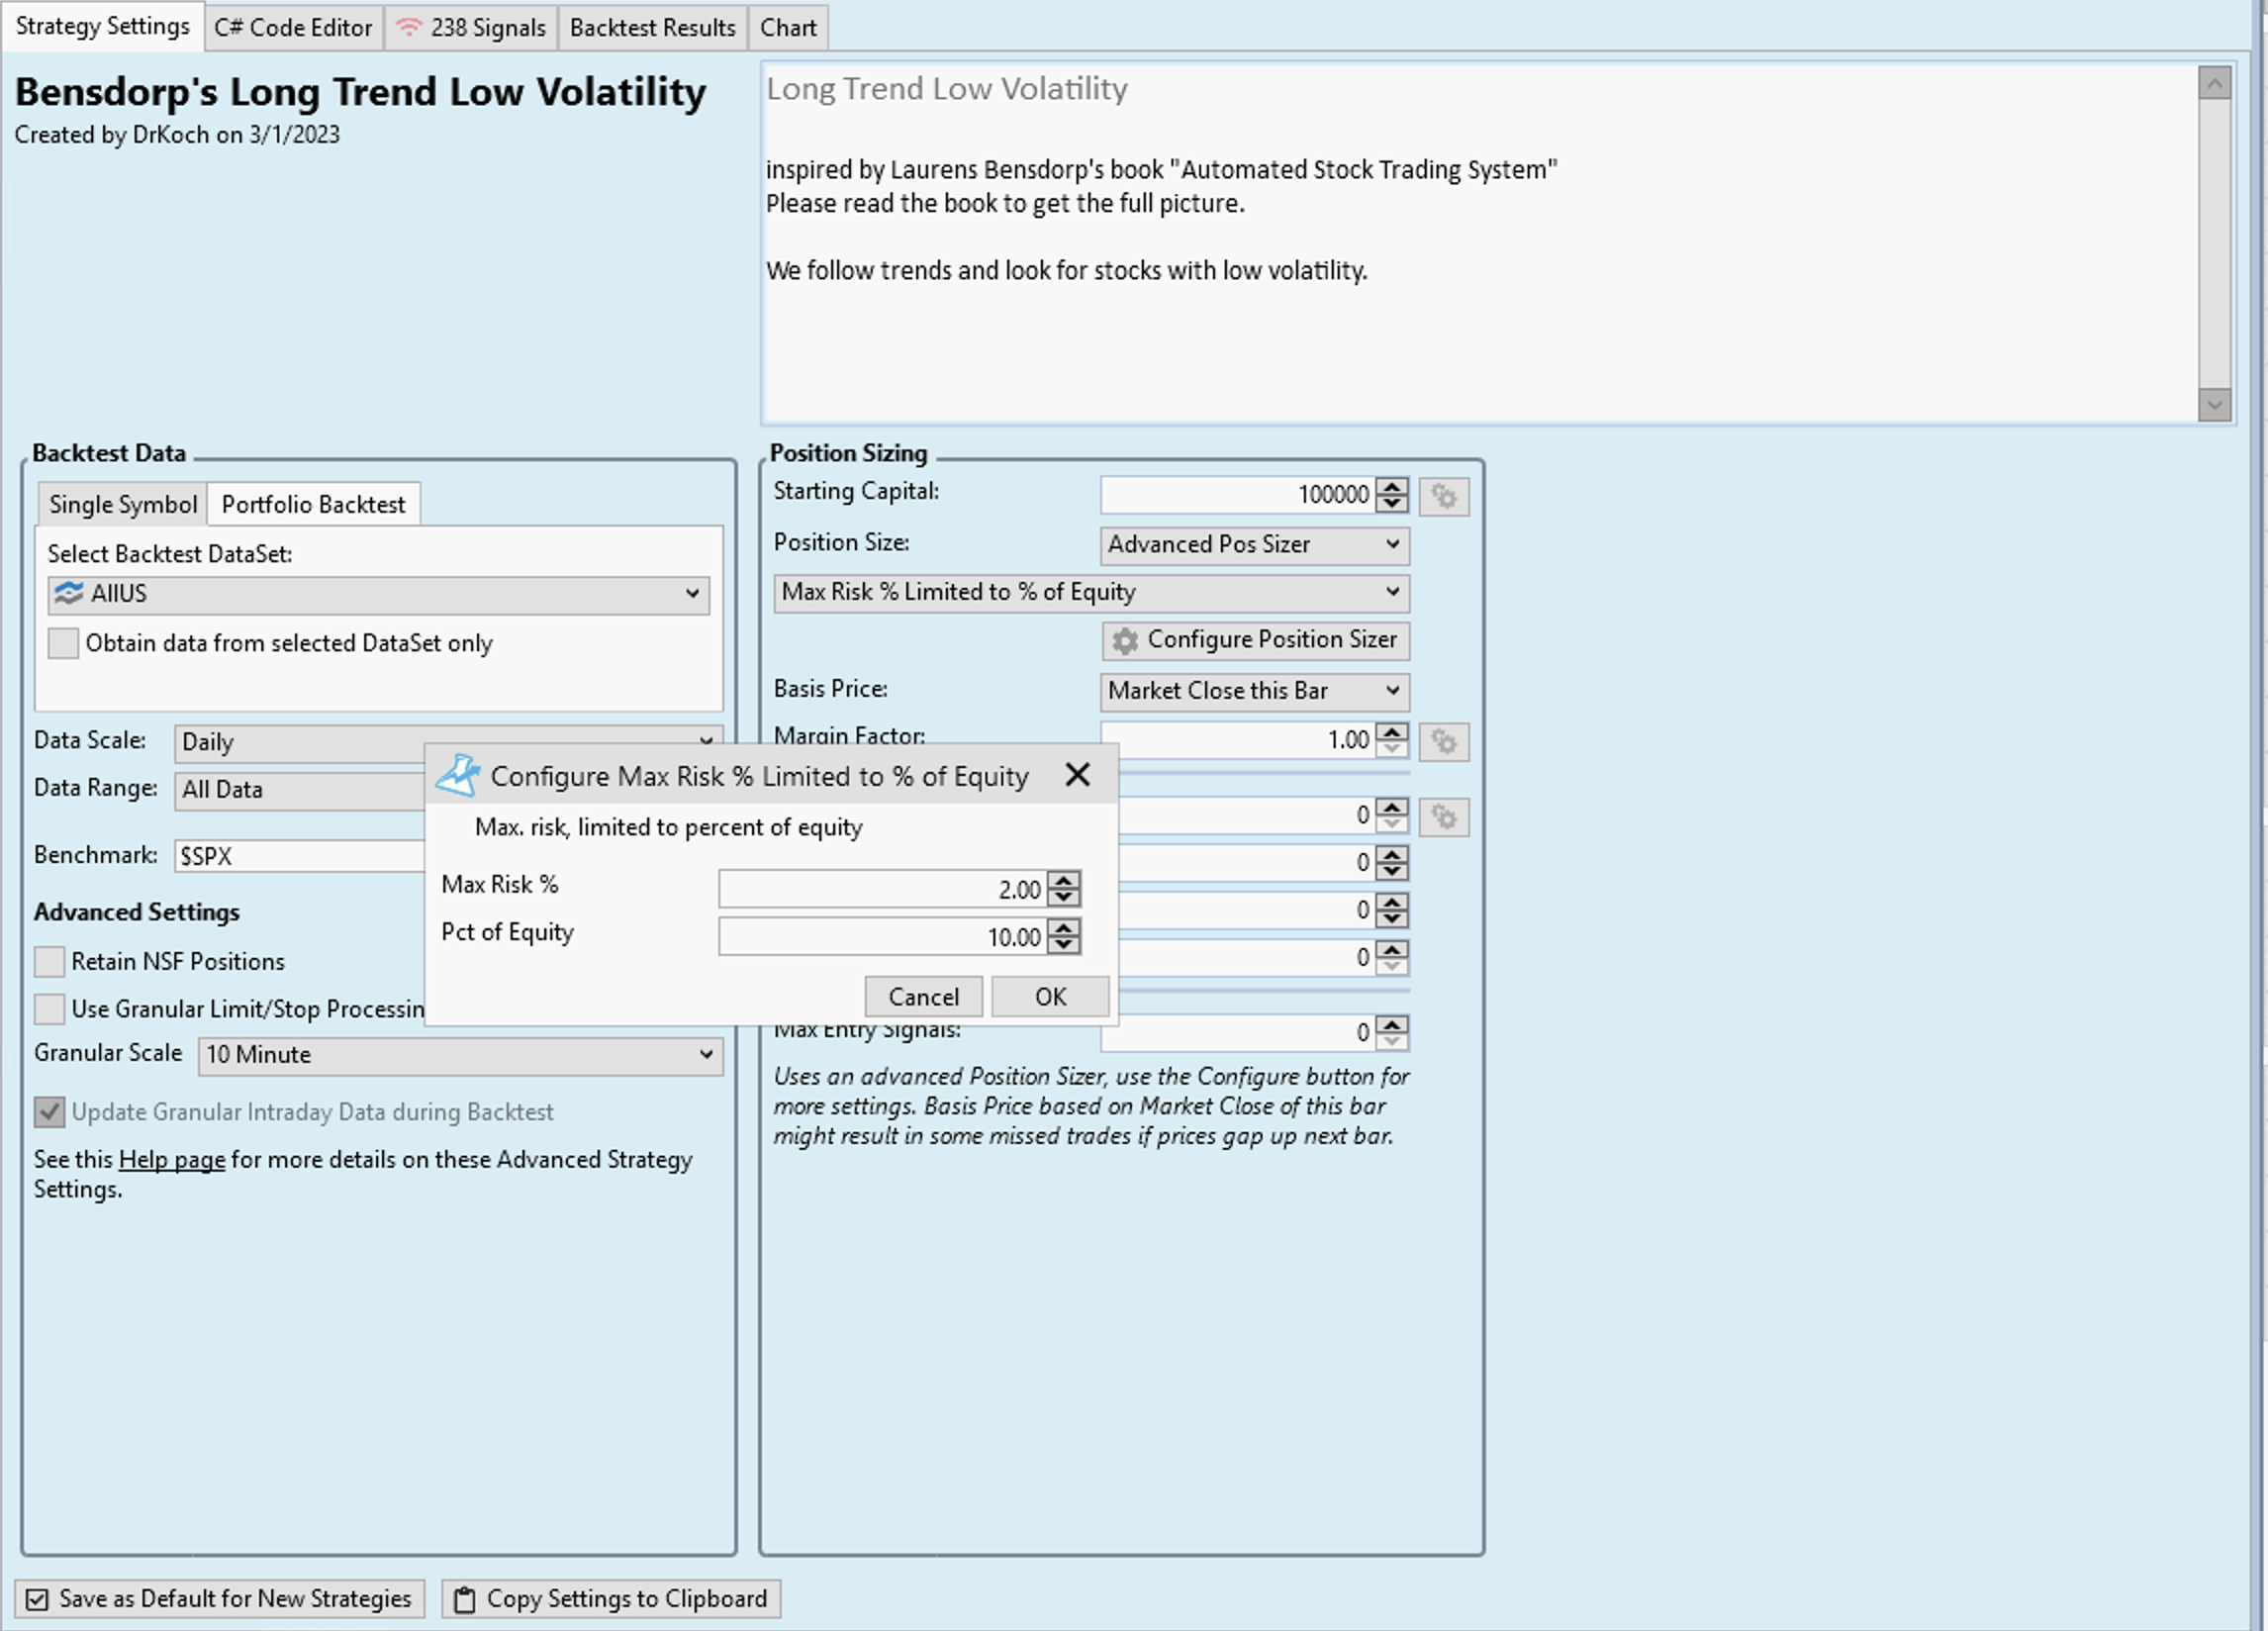
If you read the book, you'll see that Bendorp uses "Max Risk % Limited to % of Equity" in most of his strategies. For reasons unkonwn to me the publisher strategies come with Position Size: "Percent of Equity". This is not intended and you should change the position sizing method accordingly.
QUOTE:
In this case, wouldn't defining the GetMaxRiskStopLevel in the code be redundant
Yes. The GetMaxRiskStopLevel() routine is used by "Risk %" position sizers only.
QUOTE:
Furthermore, can I kindly ask where in the code sets the 2% Risk level per trade?
This is a property of the (Advanced) pos sizer. It is set outside the strategies code.
Go to Strategy Settings->Position Sizing.
Select Position Size: Advanced Pos Sizer
Select the "max Risk % Limited to % of Equity" Positon Sizer.
Click "Configure Position Sizer"
Here it is possible to set:
Max Risk %: 2.0
Pct of Equity: 10.0
Hi everyone,
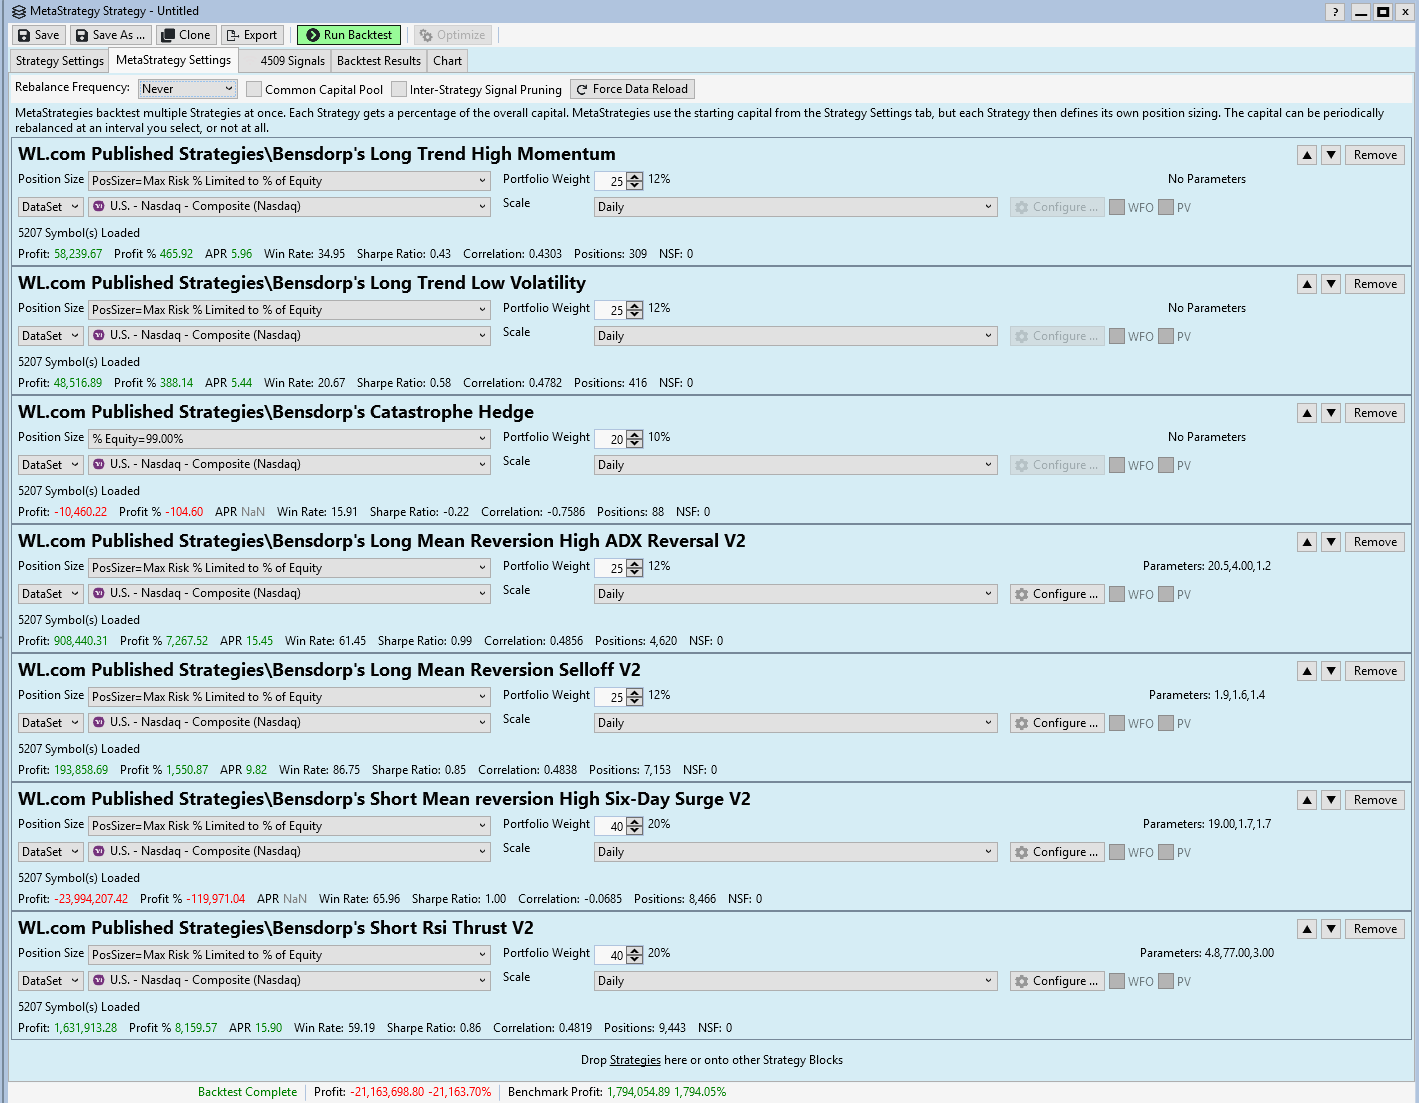
I've recently gone through Laurens' book and acquired stock market data from Norgate, allowing me to backtest US stock markets starting from 1995. I evaluated the strategies individually before integrating them into a meta-strategy to assess the benefits of such combinations.
However, I encountered some odd results with the short mean reversion strategies, particularly when applying the current and historical data from the Russell 3000 index provided by Norgate. It seems I'm overlooking something, leading to these discrepancies. To investigate, I conducted tests with a smaller sample and used data from WealthData for comparison purposes.
I apologize for the multitude of screenshots, but I wanted to give you a clear picture of my methodology and the outcomes. It appears that expanding the stock market universe exacerbates the inexplicable results.
Here are my initial test results using S&P 500 data from WealthData:

These results are logical.

Conducting the same test with S&P 500 data from Norgate yields:

The results are almost identical, which is reassuring.

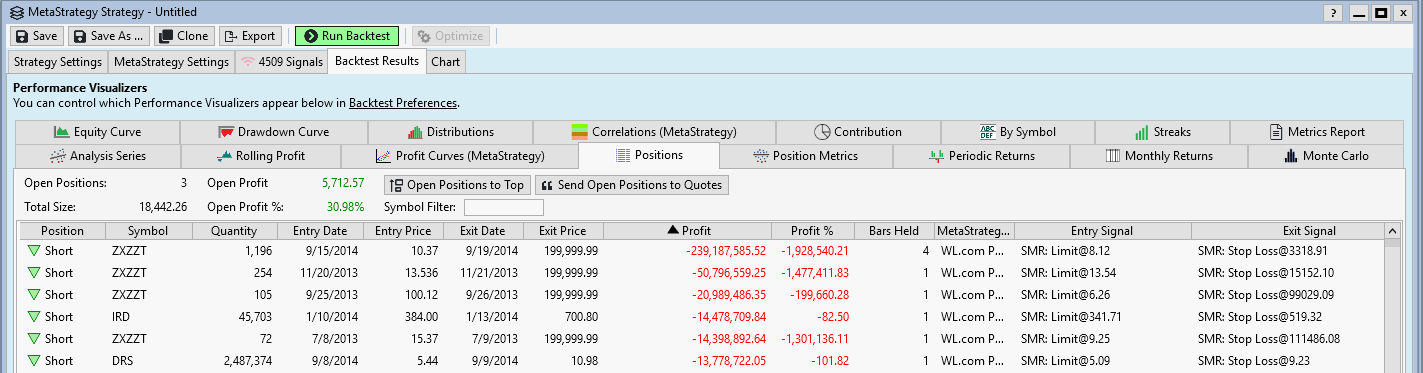
However, testing with the Russell 3000 data reveals:

The outcome here is quite perplexing, to say the least.

I confirmed that the strategy adheres to the limit of 10 active trades simultaneously by using DrKoch's FillProbability. It does, yet with the Russell 3000 data, it resulted in 17,000 trades. DrKoch modified the parameters from the book after backtesting with a more limited stock sample.
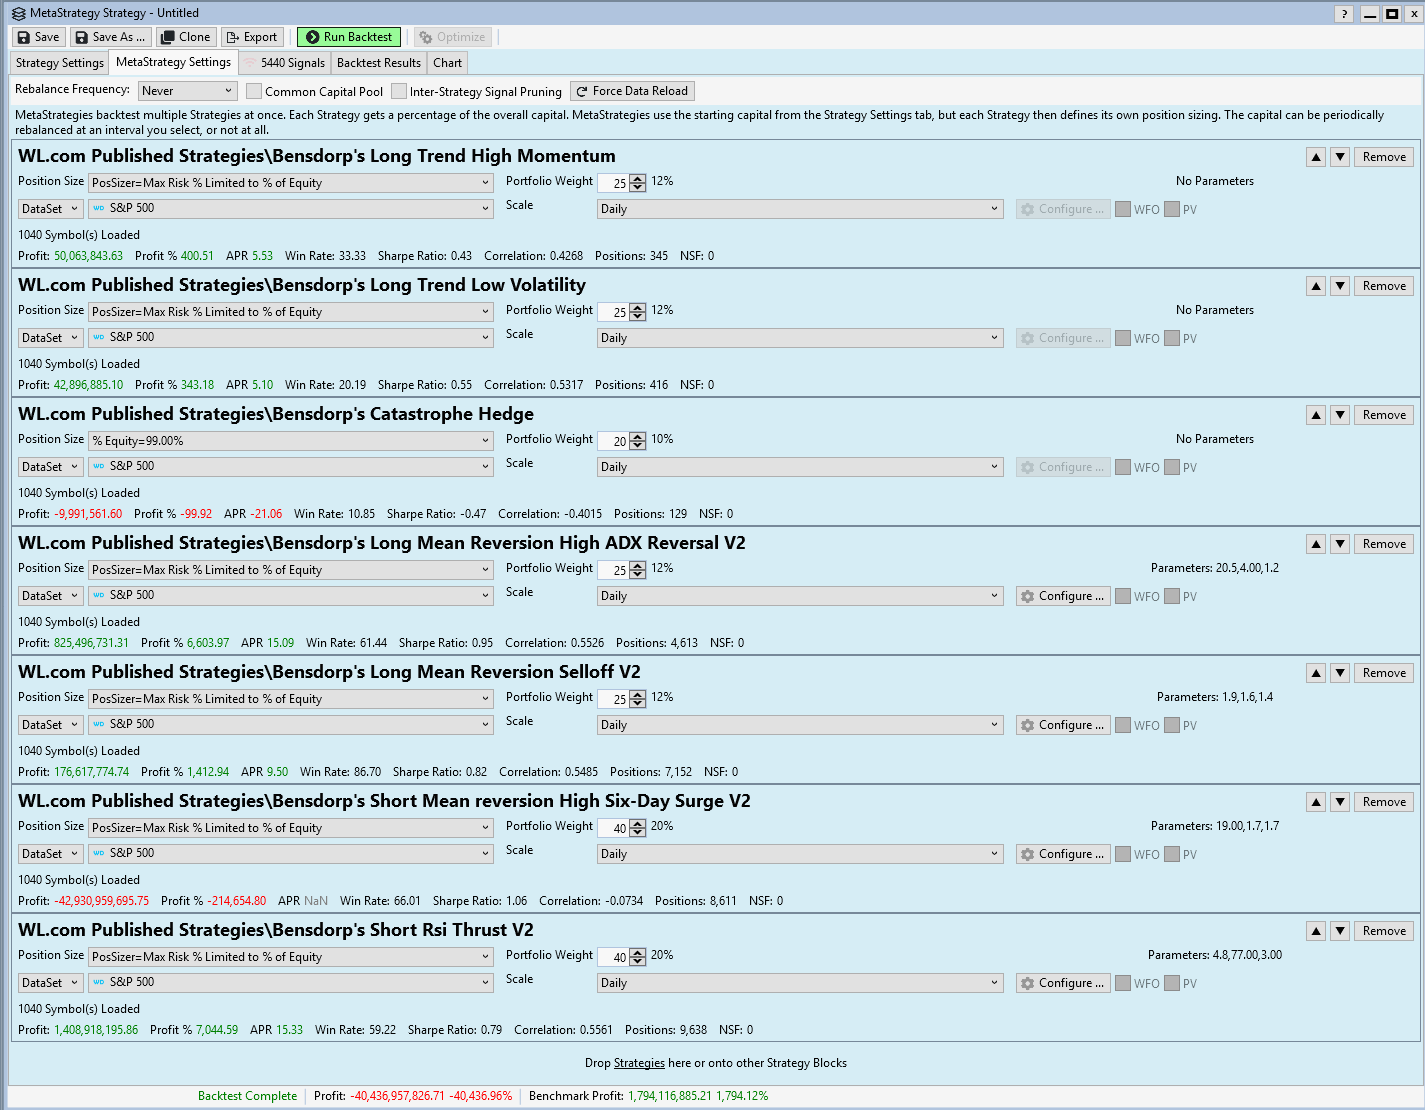
I made a second test with the original parameters from the book:

Yet again, the results were nonsensical.

This amounted to a total of 11,000 trades.
Do you have any insights into what might be happening? I've double-checked the C# code to ensure there is no look-ahead bias that could distort the results.
Let me know if you want to see additional parameters in WL8.
Spacious
I've recently gone through Laurens' book and acquired stock market data from Norgate, allowing me to backtest US stock markets starting from 1995. I evaluated the strategies individually before integrating them into a meta-strategy to assess the benefits of such combinations.
However, I encountered some odd results with the short mean reversion strategies, particularly when applying the current and historical data from the Russell 3000 index provided by Norgate. It seems I'm overlooking something, leading to these discrepancies. To investigate, I conducted tests with a smaller sample and used data from WealthData for comparison purposes.
I apologize for the multitude of screenshots, but I wanted to give you a clear picture of my methodology and the outcomes. It appears that expanding the stock market universe exacerbates the inexplicable results.
Here are my initial test results using S&P 500 data from WealthData:
These results are logical.
Conducting the same test with S&P 500 data from Norgate yields:
The results are almost identical, which is reassuring.
However, testing with the Russell 3000 data reveals:
The outcome here is quite perplexing, to say the least.
I confirmed that the strategy adheres to the limit of 10 active trades simultaneously by using DrKoch's FillProbability. It does, yet with the Russell 3000 data, it resulted in 17,000 trades. DrKoch modified the parameters from the book after backtesting with a more limited stock sample.
I made a second test with the original parameters from the book:
Yet again, the results were nonsensical.
This amounted to a total of 11,000 trades.
Do you have any insights into what might be happening? I've double-checked the C# code to ensure there is no look-ahead bias that could distort the results.
Let me know if you want to see additional parameters in WL8.
Spacious
@spacious , I also look first at the equity curve. When it looks interesting, I start diving deeper in the results.
Sort the results of all trades to highest win% to see if you there are abnormal winners. Than I also sort on losers.
Than I check the signals on the charts of those winners/losers.
You'll notice if this all is realistic or not.
I would suggest to use semi LOG scale for the equity curve.
Don't have the correct plugins to test the results of Bensdorp's strategies but my first impression is that it seems to have only added value if you follow them all.
Is the APR than 'only' 15%?
This is without fees? What about slippage?
Someone has real live trading experience with this?
It is a good thing that the tests are on WL/Norgate data (non-biased).
Can only appreciate he dares to publish everything all in public. Most pro's only show signals at best, never backtesting results.
I've identified an issue with the GetMaxRiskStopLevel function that manifests as a peak in future, affecting position sizing, especially when trades move against us on the first day. Allow me to clarify with a detailed example.
Initial Invocation at Daily Close
The first call to GetMaxRiskStopLevel occurs at daily close, when determining the limit orders size for the next day. The sizing is based on the anticipated entry price plus 3ATR, which in my case, factored a 4% rise in the price.

To track when this function is triggered, I added a WriteToDebugLog call within GetMaxRiskStopLevel, as some trades seemed to have incorrect position sizing.
Second Call on Order Fill Day
On the day the limit order fills, GetMaxRiskStopLevel is called again. This time it adjust position size using the closing price of the current day, which result in a future peak that's not yet known at order placement.
Example from Backtesting
With an equity of 100k and a 2% max risk or 10% equity cap for position sizing, let's examine a real example from my backtesting:
Trade Date: Symbol CHKR on 1995-02-01 - shorted 145 shares at $30
Here's the debug log for this symbol:

And the chart, showcasing the initial trade:

The closing price before the trade was $28.5. Using the Bensdorp Short RSI Thrust strategy, the buy price is projected at 4% higher, resulting in an entry price of $29.64 (28.50 * 1.04). The stop loss is set at 3ATR over 10 days (3 * 1.37 = 4.11). Notably, the position was entered at $30 due to a gap up.
However, the position sizing was based on the 29.64 entry price. Therefore, 10% equity would equate to 337 shares (10,000 / 29.64) or 2% risk would be 486 shares (2000 / 4.11). I would have expected to buy 337 shares.
The subsequent stop level calculation (29.64 + 4.11 = 33.75) matches the figure from the first debug log.
So why only 145 shares? Although initially confusing, this made sense as the second GetMaxRiskStopLevel call on the filling day adjusted the position size using the day's closing price, which was not yet finalized: $36.
Here's the calculation breakdown:
Closing price: $36
ATR: $1.98
Calculated position size: 36 * 1.04 = 37.44 + (3 * 1.98) = 43.38
The difference between the entry price and the stop loss level was $13.74 (43.38 - 29.64), leading to a position size of 145 shares based on a 2% risk ($2000 / 13.74).
This behavior occurs regardless of whether the price moves in or against your favor on the first day, leading to future peaks or dips that subsequently affect position sizing.
Seeking a Solution
What's the next step to address this? I'm considering raising this as a bug report and am eager to hear what Cone and Eugene think.
Maybe I should start a new post before reporting this as a bug. Let me know
thx
Spacious
Initial Invocation at Daily Close
The first call to GetMaxRiskStopLevel occurs at daily close, when determining the limit orders size for the next day. The sizing is based on the anticipated entry price plus 3ATR, which in my case, factored a 4% rise in the price.
To track when this function is triggered, I added a WriteToDebugLog call within GetMaxRiskStopLevel, as some trades seemed to have incorrect position sizing.
Second Call on Order Fill Day
On the day the limit order fills, GetMaxRiskStopLevel is called again. This time it adjust position size using the closing price of the current day, which result in a future peak that's not yet known at order placement.
Example from Backtesting
With an equity of 100k and a 2% max risk or 10% equity cap for position sizing, let's examine a real example from my backtesting:
Trade Date: Symbol CHKR on 1995-02-01 - shorted 145 shares at $30
Here's the debug log for this symbol:
And the chart, showcasing the initial trade:
The closing price before the trade was $28.5. Using the Bensdorp Short RSI Thrust strategy, the buy price is projected at 4% higher, resulting in an entry price of $29.64 (28.50 * 1.04). The stop loss is set at 3ATR over 10 days (3 * 1.37 = 4.11). Notably, the position was entered at $30 due to a gap up.
However, the position sizing was based on the 29.64 entry price. Therefore, 10% equity would equate to 337 shares (10,000 / 29.64) or 2% risk would be 486 shares (2000 / 4.11). I would have expected to buy 337 shares.
The subsequent stop level calculation (29.64 + 4.11 = 33.75) matches the figure from the first debug log.
So why only 145 shares? Although initially confusing, this made sense as the second GetMaxRiskStopLevel call on the filling day adjusted the position size using the day's closing price, which was not yet finalized: $36.
Here's the calculation breakdown:
Closing price: $36
ATR: $1.98
Calculated position size: 36 * 1.04 = 37.44 + (3 * 1.98) = 43.38
The difference between the entry price and the stop loss level was $13.74 (43.38 - 29.64), leading to a position size of 145 shares based on a 2% risk ($2000 / 13.74).
This behavior occurs regardless of whether the price moves in or against your favor on the first day, leading to future peaks or dips that subsequently affect position sizing.
Seeking a Solution
What's the next step to address this? I'm considering raising this as a bug report and am eager to hear what Cone and Eugene think.
Maybe I should start a new post before reporting this as a bug. Let me know
thx
Spacious
Are you using an Advanced Position Sizer?
I see it's called only once when using Maximum Risk Position Sizing, but twice when using an Advanced Position Sizer.
And that second call is indeed one bar ahead, we'll work on correcting that.
I see it's called only once when using Maximum Risk Position Sizing, but twice when using an Advanced Position Sizer.
And that second call is indeed one bar ahead, we'll work on correcting that.
Thx Glitch for the quick answer.
I'm using Advanced Position Sizer

Spacious
I'm using Advanced Position Sizer
Spacious
Thanks, we have it rectified for Build 55.
Nice catch Spacious!
I just bought the finantic.indicators extension to get inspired by Bensdorp's strategy portfolio.
Apparently I am getting quite different results.
What am I doing wrong?

Apparently I am getting quite different results.
What am I doing wrong?
Compare your setup with the screenshot in Post #41.
(Hint: Position Sizer and Portfolio Weight)
What is your data range (i.e start date /end date of Backtest)
(Compare with information at start of this discussion thread)
What are your Strategy Settings?
What are your Results (Equity Curve of Meta-Strategy, Individual Equity curves of sub-strategies)?
In short: Give us more information to help us to help you.
PositionSizer Settings
Max Risk % --> 2.00
Pct of Equity --> 10.00


Max Risk % --> 2.00
Pct of Equity --> 10.00
In the Bensdorp's book he is using the complete US Stocks markets and you are only using the S&P500 which doesn't give you enough instruments diversification.
I'am running some of Bensdorp strategy using the russell 3000 and I bought the data on NorgateData.
Spacious
I'am running some of Bensdorp strategy using the russell 3000 and I bought the data on NorgateData.
Spacious
It looks like there is not enough capital being used, try using Shared Capital Pooling or set a high margin factor of like 6:1 on each component strategy in the MetaStrategy.


Well there was a bug in the advanced pos sizer which was peeking in the future. It has been fixed and maybe that's the reason why you can't get the same result. I will try to make a test tonight with SMR Six Day Surge and compare with your result.
Sorry for the delay,
I just ran the SMR-SixDaySurge and I got the same result than you with the s&p500. I suspect that the advanced pos sizer bug fix is the main reason the result are different.
I also retried with russell 3000 current & past norgate data with the orginal paramater from the book and you can see a better result since there is more instruments diversification.
Hi DrKoch,
I was able create a MetaStrategy as you did for the Bensdorp strategies and my backtesting results were impressive much like yours. When I tried to run Monte Carlo simulations the results were the exact opposite and basically implied that these should never be traded live as a group. Maybe I am not using the tool correctly since the result are not what I expected. Have you ran Monte Carlo simulations on this MetaStrategy and what were the results?
I was able create a MetaStrategy as you did for the Bensdorp strategies and my backtesting results were impressive much like yours. When I tried to run Monte Carlo simulations the results were the exact opposite and basically implied that these should never be traded live as a group. Maybe I am not using the tool correctly since the result are not what I expected. Have you ran Monte Carlo simulations on this MetaStrategy and what were the results?
QUOTE:
my backtesting results were impressive much like yours.
That is good to hear!
QUOTE:
Have you ran Monte Carlo simulations
No, I haven't used Monte Carlo for some time now.
Probably some Monte-Carlo expert can jump in?
What finantic extension are required to backtest this system, I am on build 81. Some of finantic extensions are not yet .net8 compliant.
As of today all finantic Extensions should work.
Please report any problems you see...
Please report any problems you see...
Thanks DrKoch for this amazing article and all the strategies shared!
I just finished reading this book over the weekend and am trying to reproduce these strategies in building blocks today. That's why I initiated a question regarding ranking stocks. Luckily, I came across this article in time.
I just finished reading this book over the weekend and am trying to reproduce these strategies in building blocks today. That's why I initiated a question regarding ranking stocks. Luckily, I came across this article in time.
(1)My question was which extension I need to buy to run backtest on this system
(2)Where is the list of the stocks used for backtesting as I can not find wealthsignals. I guess I have to make a new one but how
(3) What is portfolio weight 25 in the spinner then 12%. what is that mean. It looks like when sharing capitol pool is selected in meta strategy it disables portfolio weight, does backtest reassign value based on number of strategies in metastrategy, for 8 strategies it comes to 12%, am i making correct assumption?
QUOTE:
which extension I need
As shown in Post #41 the book (and the strategies here) use a Position Sizer here called "Max Risk % Limited to % of Equity". This position sizer is part of the finantic.Indicators extension.
(see https://wealth-lab.com/extension/detail/finantic.Indicators)
The strategies use the "AvgTurnover" indicator, also part of finantic.Indicators.
No other extension are required to make the bensdorp scripts run.
QUOTE:
I can not find wealthsignals
WealthSignals stopped some time ago. Post #34 (and follow ups) discuss alternative portfolio. My advice: The larger the portfolio, the better the results. But you need to adjust some parameters in the stratgies to larger portfolios and more RAM for more symbols.
QUOTE:
What is portfolio weight
Please see WL's Help. Please start a new discussion thread if you see any inconsistencies.
Hi all! Has anybody been able to successfully reproduce strategy results from the book on Norgate data like Russel 3000 w/o survivorship bias?
I too have been fascinated by Laurens Bendsdorp’s book. Many thanks to everyone who took the time to do all the work and post these discussion entries.
I am curious if anyone has tried trading this live as a MetaStrategy yet? I am also curious if anyone has spoken with Lorens or Alexei or has looked into his mentorship program.
Best regards.
I am curious if anyone has tried trading this live as a MetaStrategy yet? I am also curious if anyone has spoken with Lorens or Alexei or has looked into his mentorship program.
Best regards.
Still wondering if anyone has traded this suite of systems or a similar one live. I understand the concept of multiple non correlated system having a moderating effect on equity curve and drawdowns when used together as a whole suite. But I am a newbie to backtesting and a novice in regard to multiple simultaneous systems as well. When I was reading his book, and also Alexei Rudometkin's similar book on his work with Laurens, followed them designing a system, then looking for time periods where that system struggled and designing another system designed to tried to mitigate the big draw downs of the first and testing them together then repeating to add a third and fourth and many more systems each conceived with an idea of how to "fill the potholes" on the equity curve until in the end when the whole suite of systems is tested together it produces a very pleasant equity curve with good cagr and minimal maximum % drawdowns. My naive thought was, "Isn't this just a very complicated way of designing a system that is perfectly fitted to do well over the historical data used?" What am I missing here, that would make us believe that this end combination of strategies works as a robust system that will help us have a smoother ride over all kinds of markets? Rather than just misleading ourselves to have faith in a system that works perfectly with the historical data available to us but could be a disaster when used going forward in live trading? I'd like to believe that this concept works as well as it looks. Can anyone help me with that?
QUOTE:
Can anyone help me with that?
I think this discussion thread is a great place to discuss these things.
QUOTE:
then looking for time periods where that system struggled and designing another system designed to tried to mitigate the big draw downs of the first
Well, it might look like that, but the actual thinking is the other way round:
You design several possibly uncorrelated systems and hope that the combined equity curve looks better than the individual ones.
(It is not possible to design a system that will compensate for another's "potholes", because the future is unknown. You can do this in backtest optimizations only, if all the data is known)
QUOTE:
What ... would make us believe
There is the basic concept of "Diversification" at play. Statistically, the sum of several uncorrelated random variables have a lower standard deviation then the sum of the individual standard deviations.
Or to put it simpler: You can hear these effects: If you replace a single violin by four violins, all playing the same tune, the sum of all four is twice as loud (not four times as loud) as the single violin, because the instruments vibrate uncorrelated and thus partly cancel each other out.
Diversification (or summing up uncorrelated things) is a powerful method. It can be applied on various levels:
* trade a portfolio of stocks instead of a single one.
* trade a portfolio of strategies instead of a single one.
The math behind it requires two things:
1. the individual time series should be as uncorrelated as possible
2. The "amplitude" (a.k.a. standard deviation) of all time series should be similar.
From the first condition follows that a large portfolio (e.g. S&P 1500) is more likely to contain useful symbols than a narrow portfolio like "Nasdaq-100" where many stocks are highly correlated.
From the second condition follows, that the position size for volatile stocks should be smaller than the position size for stocks with low volatility.
QUOTE:
Rather than just misleading ourselves to have faith in a system that works perfectly with the historical data available to us but could be a disaster when used going forward in live trading?
There are several measures to avoid this effect, also known as "curve fitting" and "over-optimization":
* make a careful choice of Date-Ranges to work with. It is critical to use one date-range for Development (any changes to the strategy and testing these changes) and one or several date-ranges for "cross-validation".
I tend to use four intervals:
* Backtest/Training: Here all decisions are executed and evaluated
* Test1: First Out-of sample interval
* Test2: second out-of sample interval
* Validation: Third out-of sample interval
I always choose the end of the last interval a few moths in the past.
All modifications which are successful in the backtest interval are carefully checked in these other intervals.
Thanks so much for your reply DrKoch. I am so far over my head here, I appreciate you bringing the explanation down to my level.
Hello Glitch, thank you for your participation here. Back in Jan, on this thread in Post #67 you wrote:
"It looks like there is not enough capital being used, try using Shared Capital Pooling or set a high margin factor of like 6:1 on each component strategy in the MetaStrategy."
What beginning equity would you think is necessary to make this strategy work in live trading?
"It looks like there is not enough capital being used, try using Shared Capital Pooling or set a high margin factor of like 6:1 on each component strategy in the MetaStrategy."
What beginning equity would you think is necessary to make this strategy work in live trading?
It seems like the interest in this thread died out back in July. I never saw a post by anyone here saying they had tried to actually trade the concept discussed above. But I continued to be fascinated by the entire concept. That led me to enroll in Laurens Bensdorp’s mentorship program after spending a couple of months communication with Laurens and also Alexei Rudametkin. I began the mentorship in September and since then, with the help of both of them and others in the mentorship group, I have so far developed a suite of 22 trading systems. After I fine tune their interactions and make sure the correlation is as limited as possible, and deciding on the optimal allocations to each system, I will begin trading them live using an IBKR account. If anyone has a real interest in my experience feel free to contact me. I will be happy to share my ongoing learning and results of trading the systems live when that happens.
Is there a way that we can send a direct message to each other here?
There is not.
You could use the WL Discord for DMs.
@wcjarvis: you can find the WL Discord on the WL software homepage (icon at the bottom).

@wcjarvis: Do you have an ID on discord? I would love to reach out to you to find out more about your experience with the programme which you mentioned.
@pmbf I do. My discord ID is wayne_51751
If you add me as a friend I can invite you to a discussion of that topic and or we can DM privately.
If you add me as a friend I can invite you to a discussion of that topic and or we can DM privately.
Theres is something wrong w $NCLH from the WL S&P 500 dataset.
If you backtest Bensdorp short RSI keeps on showing a need to cover the trade despite it having been covered months ago 7/19/2024.
If you backtest Bensdorp short RSI keeps on showing a need to cover the trade despite it having been covered months ago 7/19/2024.
I think you're right that something was wrong. The symbol database might have been out of sync with our master.
Restart WL now and try again.
Restart WL now and try again.
FYI:
Still wonky..
Still wonky..
Can you show us the wonkiness and how to duplicate it?
When I run that strategy on the S&P 500 for the last 10 years (10% of Equity sizing), these are all the NCLH trades. All trades were closed and none were held more than 4 bars.

When I run that strategy on the S&P 500 for the last 10 years (10% of Equity sizing), these are all the NCLH trades. All trades were closed and none were held more than 4 bars.
Disregard. Cleaned up, took an extra day of synching for me?
Best.
Best.
@pmbf
@wcjarvis Laurens Bensdorp Can I talk to you about the system and mentoring program? My Discord ID is supertrader_no1.
@wcjarvis Laurens Bensdorp Can I talk to you about the system and mentoring program? My Discord ID is supertrader_no1.
Since my post on January 1, 2025 I completed developing my systems for both my retirement account and my regular brokerage account. I have been trading them live for about six months now. I wanted to update everyone on what my backtesting results from my final suites are, and a summary of my results in trading them live.
Here are the results from my IRA account, backtested from Jan 1, 2007 to present, using $500,000 for starting equity and for my taxable account using $200,000K starting equity.
They are followed by the live results of trading both suites at Interactive Brokers. The IRA account went live Jan 21 and the other account went live Feb 14th.
If anyone has questions or wants to discuss any of this in detail my discord ID is wayne_51751
Happy trading!
Happy trading!
Hi everyone,
I am trying now for quite some time to reproduce the results of Bensdorp without any success. What I did was to setup an "AllUS" Watchlist in Norgate like so
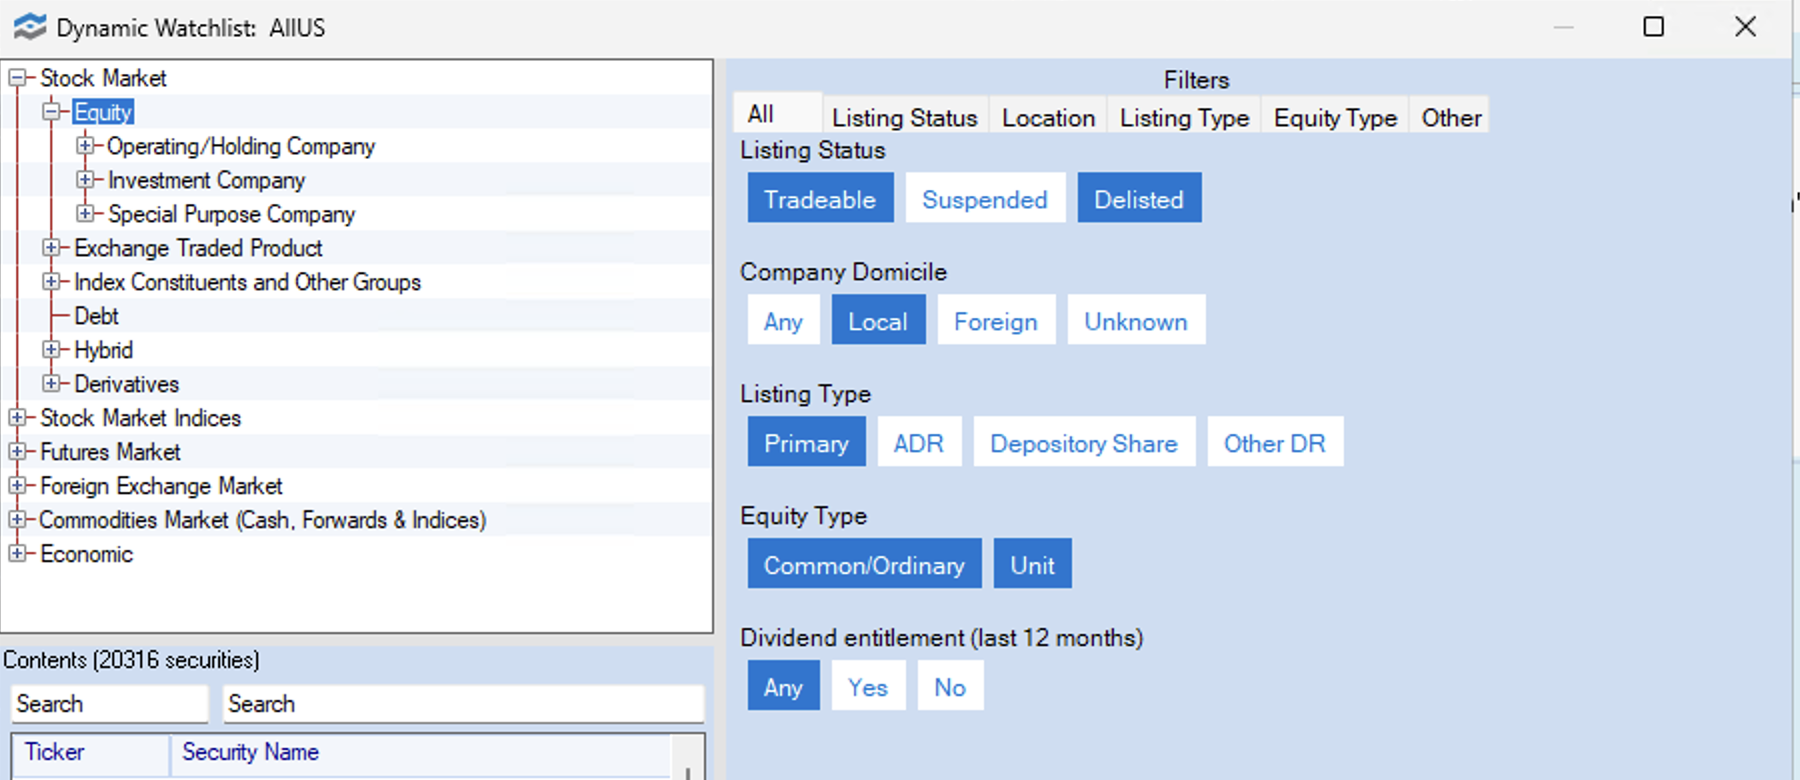
which ended up in roughly 20000 symbols. This is not anywhere near the universe of Bensdorp but should be close enough in my opinion. Next step was to take exactly (except for Norgate's MajorExchangeListedTimeSeries time series)the strategies as they come with WL, e.g.
and let it run with my watchlist. However, the results are quite disapointing and not anywhere close to results from the book (Results are similar bad for the other strategies)
Does anybody have any advice what could be wrong with my setup?
Thank you guys
I am trying now for quite some time to reproduce the results of Bensdorp without any success. What I did was to setup an "AllUS" Watchlist in Norgate like so
which ended up in roughly 20000 symbols. This is not anywhere near the universe of Bensdorp but should be close enough in my opinion. Next step was to take exactly (except for Norgate's MajorExchangeListedTimeSeries time series)the strategies as they come with WL, e.g.
and let it run with my watchlist. However, the results are quite disapointing and not anywhere close to results from the book (Results are similar bad for the other strategies)
Does anybody have any advice what could be wrong with my setup?
Thank you guys
Hey all - I haven't purchased Norgate data, but have been playing around with Wealth-Lab / Yahoo data to see how results compare. I noticed some strange behaviour (maybe expected?) though when backtesting the strategy in MetaStrategies vs. as a solo strategy.
When I rebuilt DrKoch's MetaStrategy from Post #41 that my individual APRs with the S&P 500 WD data set were averaging around 6% per strategy. Then, when I backtested a single strategy in the strategy window ("Bensdorp's Long Mean Reversion High ADX Reversal V2") with the same settings and data set, its APR was almost double:
So I opened a new meta strategy window and ran the strategy solo (with the same settings):
These were close enough, so I decided to try mixing data sources on the same strategy to gut-check my S&P500 results:
You can see the individual results are much higher (particularly for the S&P 500 dataset - it's showing 22% here compared to the 12% shown before).
So then I pulled a separate data source out (Nasdaq Composite from Yahoo) and tested it as a solo strategy (with the same settings):
It's kind of interesting that everything just keeps going up! I was going to infer the obvious - using the broader stock universe as originally suggested by Bensdorp / DrKoch yields better results, but the differences between the meta-strategy window and the solo-strategy results seem to be problematic (like maybe there's a bug in how the data-sources are being cached and handled between strategy windows?)
So I went back and rebuilt the meta-strategy and ran it again with WD S&P500 data and had the same, poor results (again, different from the individual strategy test results, which had approx. 12% APR for the Mean Reversion High ADX Reversal V2 strategy):
And then just for interest/good measure/to push my PC - I tried with the Nasdaq Composite data source from Yahoo (also ... all tickers load individually for each strategy, even with common data sets selected? Seems a bit inefficient?). These results were also very poor, relative to individual tests (and DrKoch's results). They don't show the increase in APR from the S&P500 data set to the Nasdaq data set (which you can see in the above screenshots) ... and in some cases are worse (despite the solo-strategy tests being much better).
Also, separately, the surge strategy wipes everything out? Didn't think there were such glaring data quality issues with Yahoo data? Maybe this is coming into play across my other test screenshots, too (though I still would have thought the single strategy comparisons should be nearly equal between solo/meta strategy backtesting results).
But wait... what if I go back and backtest the S&P500 WD data set again?
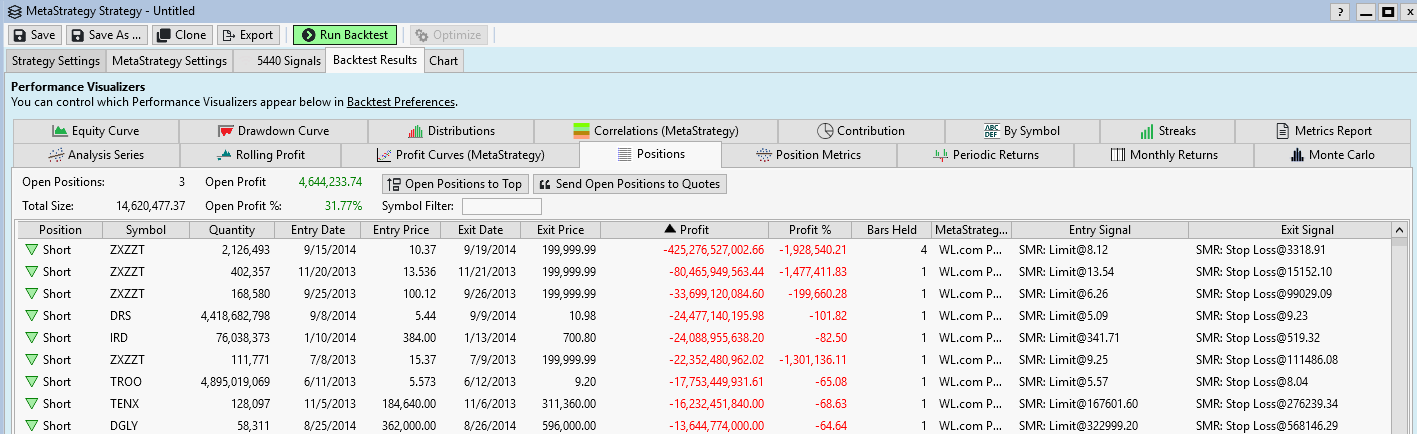
Wiped out by the random test ticker also? How'd that make its way into WD S&P 500?
So what I've observed:
1) It's obviously better to use a larger universe, as recommended (even though some of my data sets have survivorship bias, they were still sufficient to illustrate that an NYSE / Nasdaq Composite proxy for the recommended "all stocks" universe is better than the S&P 500 set).
2) While not illustrated above, I did forget to set my data set settings back 30 years from the default 10 a couple of times and also noticed poorer results. So, anyone attempting to replicate backtesting results, be sure to go back further (probably something to also unpack here ... I haven't looked at the recent dips to see how much they impacted these strategies).
3) There's an obvious difference between solo-strategy APR results and APR results when each strategy is included as a portion of a meta strategy (despite DrKoch's results in Post #41). I wouldn't have expected this, given that our dynamic (10%) risk-adjusted position sizing should scale with our equity allocations (by portfolio weight), no? Or is $100,000 starting equity too small to place efficient position sizes with a meta-strategy where less than 100% of equity is attributable to a strategy? If that were true.. I would have expected DrKoch to emphasize starting with a higher-than-default equity value ... so I'm not really sure what's happening here? I tried adding a few 0's to the strategy equity of my mixed meta-strategy tests and didn't see any significant changes.
4) Something's quite off with data caching, it would seem. As my journey continued, results became even more strange - particularly finishing off with the ZXZZT "test" ticker from the Nasdaq Composite Yahoo data set making it's way into the S&P 500 Wealth Data, data set in my last testing (last screenshot, wiping out the strategy results). I wonder how much this is affecting anyone else's results if they're trying to proof out this MetaStrategy for themselves. I capped this all off with closing Wealth-Lab, re-opening, and re-running the meta strategy with WD S&P 500 and "ZXZZT" didn't tank the portfolio (the short Surge strategy had positive results of 6% APR).
Hopefully, there's a simple answer to help d1l1x, myself, and some of the rest of the community achieve results closer to what DrKoch had posted in Post #41. I am inclined to say it's just "use 30 years of data from as large of universe as possible", but given the strange data behaviour I was experiencing, it seems difficult to replicate a consistent/ideal environment for results.
When I rebuilt DrKoch's MetaStrategy from Post #41 that my individual APRs with the S&P 500 WD data set were averaging around 6% per strategy. Then, when I backtested a single strategy in the strategy window ("Bensdorp's Long Mean Reversion High ADX Reversal V2") with the same settings and data set, its APR was almost double:
So I opened a new meta strategy window and ran the strategy solo (with the same settings):
These were close enough, so I decided to try mixing data sources on the same strategy to gut-check my S&P500 results:
You can see the individual results are much higher (particularly for the S&P 500 dataset - it's showing 22% here compared to the 12% shown before).
So then I pulled a separate data source out (Nasdaq Composite from Yahoo) and tested it as a solo strategy (with the same settings):
It's kind of interesting that everything just keeps going up! I was going to infer the obvious - using the broader stock universe as originally suggested by Bensdorp / DrKoch yields better results, but the differences between the meta-strategy window and the solo-strategy results seem to be problematic (like maybe there's a bug in how the data-sources are being cached and handled between strategy windows?)
So I went back and rebuilt the meta-strategy and ran it again with WD S&P500 data and had the same, poor results (again, different from the individual strategy test results, which had approx. 12% APR for the Mean Reversion High ADX Reversal V2 strategy):
And then just for interest/good measure/to push my PC - I tried with the Nasdaq Composite data source from Yahoo (also ... all tickers load individually for each strategy, even with common data sets selected? Seems a bit inefficient?). These results were also very poor, relative to individual tests (and DrKoch's results). They don't show the increase in APR from the S&P500 data set to the Nasdaq data set (which you can see in the above screenshots) ... and in some cases are worse (despite the solo-strategy tests being much better).
Also, separately, the surge strategy wipes everything out? Didn't think there were such glaring data quality issues with Yahoo data? Maybe this is coming into play across my other test screenshots, too (though I still would have thought the single strategy comparisons should be nearly equal between solo/meta strategy backtesting results).
But wait... what if I go back and backtest the S&P500 WD data set again?
Wiped out by the random test ticker also? How'd that make its way into WD S&P 500?
So what I've observed:
1) It's obviously better to use a larger universe, as recommended (even though some of my data sets have survivorship bias, they were still sufficient to illustrate that an NYSE / Nasdaq Composite proxy for the recommended "all stocks" universe is better than the S&P 500 set).
2) While not illustrated above, I did forget to set my data set settings back 30 years from the default 10 a couple of times and also noticed poorer results. So, anyone attempting to replicate backtesting results, be sure to go back further (probably something to also unpack here ... I haven't looked at the recent dips to see how much they impacted these strategies).
3) There's an obvious difference between solo-strategy APR results and APR results when each strategy is included as a portion of a meta strategy (despite DrKoch's results in Post #41). I wouldn't have expected this, given that our dynamic (10%) risk-adjusted position sizing should scale with our equity allocations (by portfolio weight), no? Or is $100,000 starting equity too small to place efficient position sizes with a meta-strategy where less than 100% of equity is attributable to a strategy? If that were true.. I would have expected DrKoch to emphasize starting with a higher-than-default equity value ... so I'm not really sure what's happening here? I tried adding a few 0's to the strategy equity of my mixed meta-strategy tests and didn't see any significant changes.
4) Something's quite off with data caching, it would seem. As my journey continued, results became even more strange - particularly finishing off with the ZXZZT "test" ticker from the Nasdaq Composite Yahoo data set making it's way into the S&P 500 Wealth Data, data set in my last testing (last screenshot, wiping out the strategy results). I wonder how much this is affecting anyone else's results if they're trying to proof out this MetaStrategy for themselves. I capped this all off with closing Wealth-Lab, re-opening, and re-running the meta strategy with WD S&P 500 and "ZXZZT" didn't tank the portfolio (the short Surge strategy had positive results of 6% APR).
Hopefully, there's a simple answer to help d1l1x, myself, and some of the rest of the community achieve results closer to what DrKoch had posted in Post #41. I am inclined to say it's just "use 30 years of data from as large of universe as possible", but given the strange data behaviour I was experiencing, it seems difficult to replicate a consistent/ideal environment for results.
For those who are interested here is a two month follow up to my July 23 post above. Continuing to trade the two suites of systems shown there, here is the current report of the two accounts together at Interactive Brokers. All systems were designed according to Bensdorp mentorship principles.
@wcjarvis I'd like to hear about your experience with the program. My Discord ID is danielb3488. I did send you an invite.
@wcjarvis; I would also love to discuss this with you more. I have been working on the Laurens Bensdorp systems for about 2 months. I just sent you a discord message from ChipLee. thanks
Hello my friends,
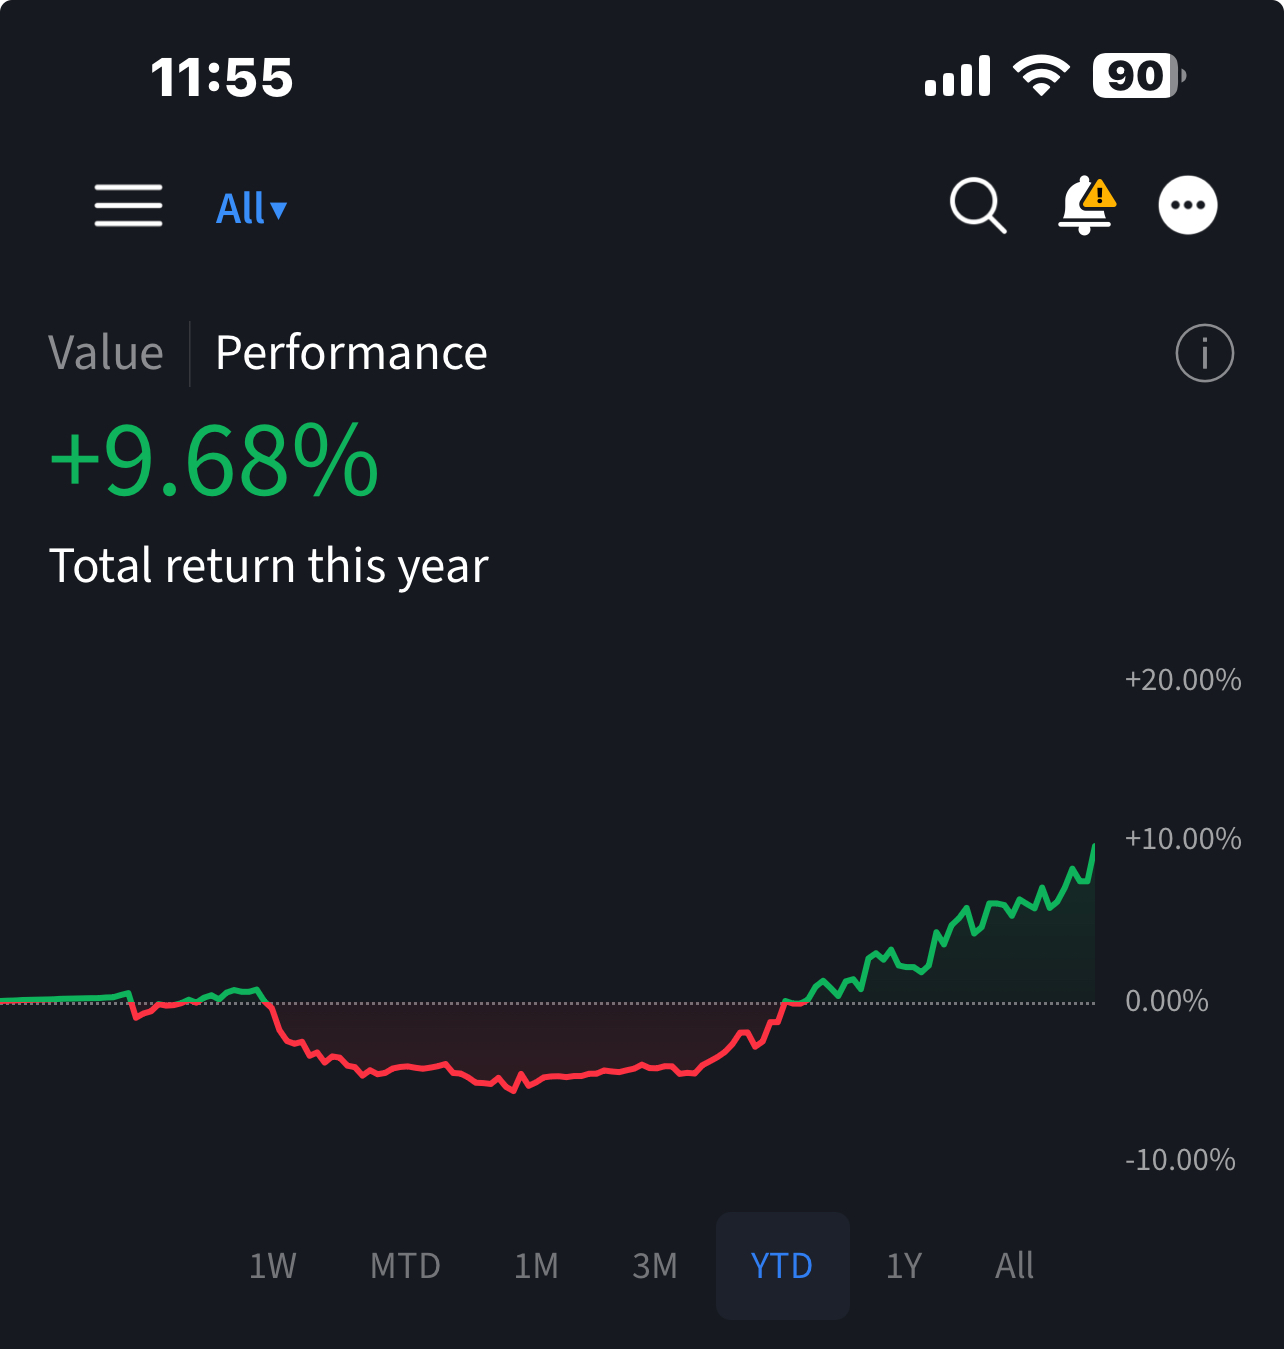
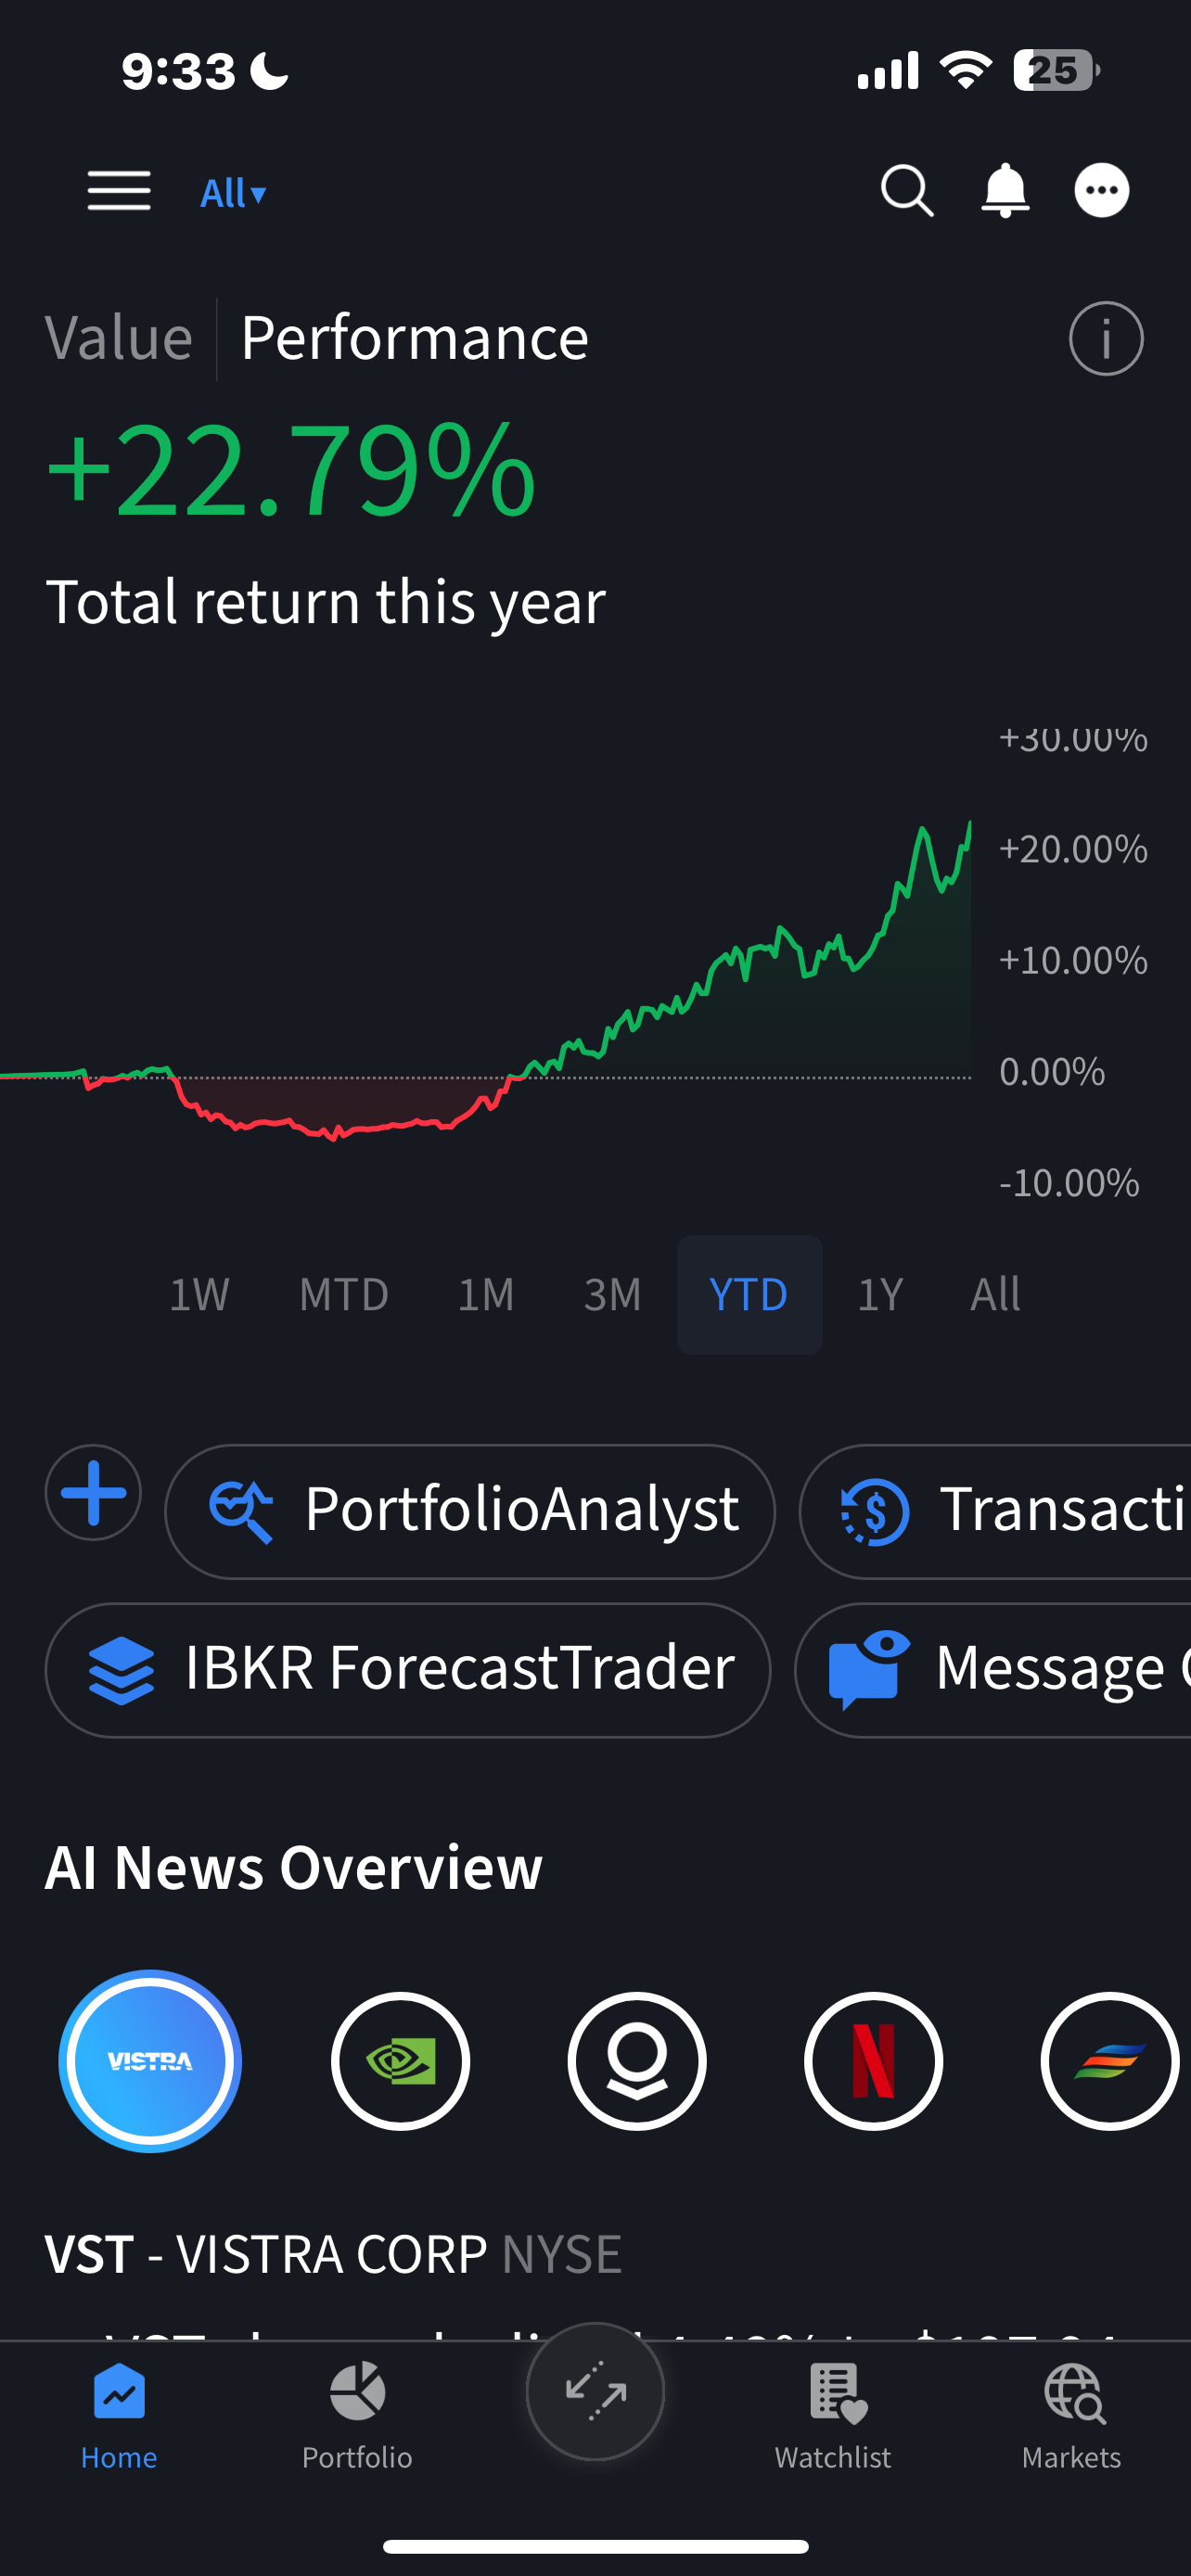
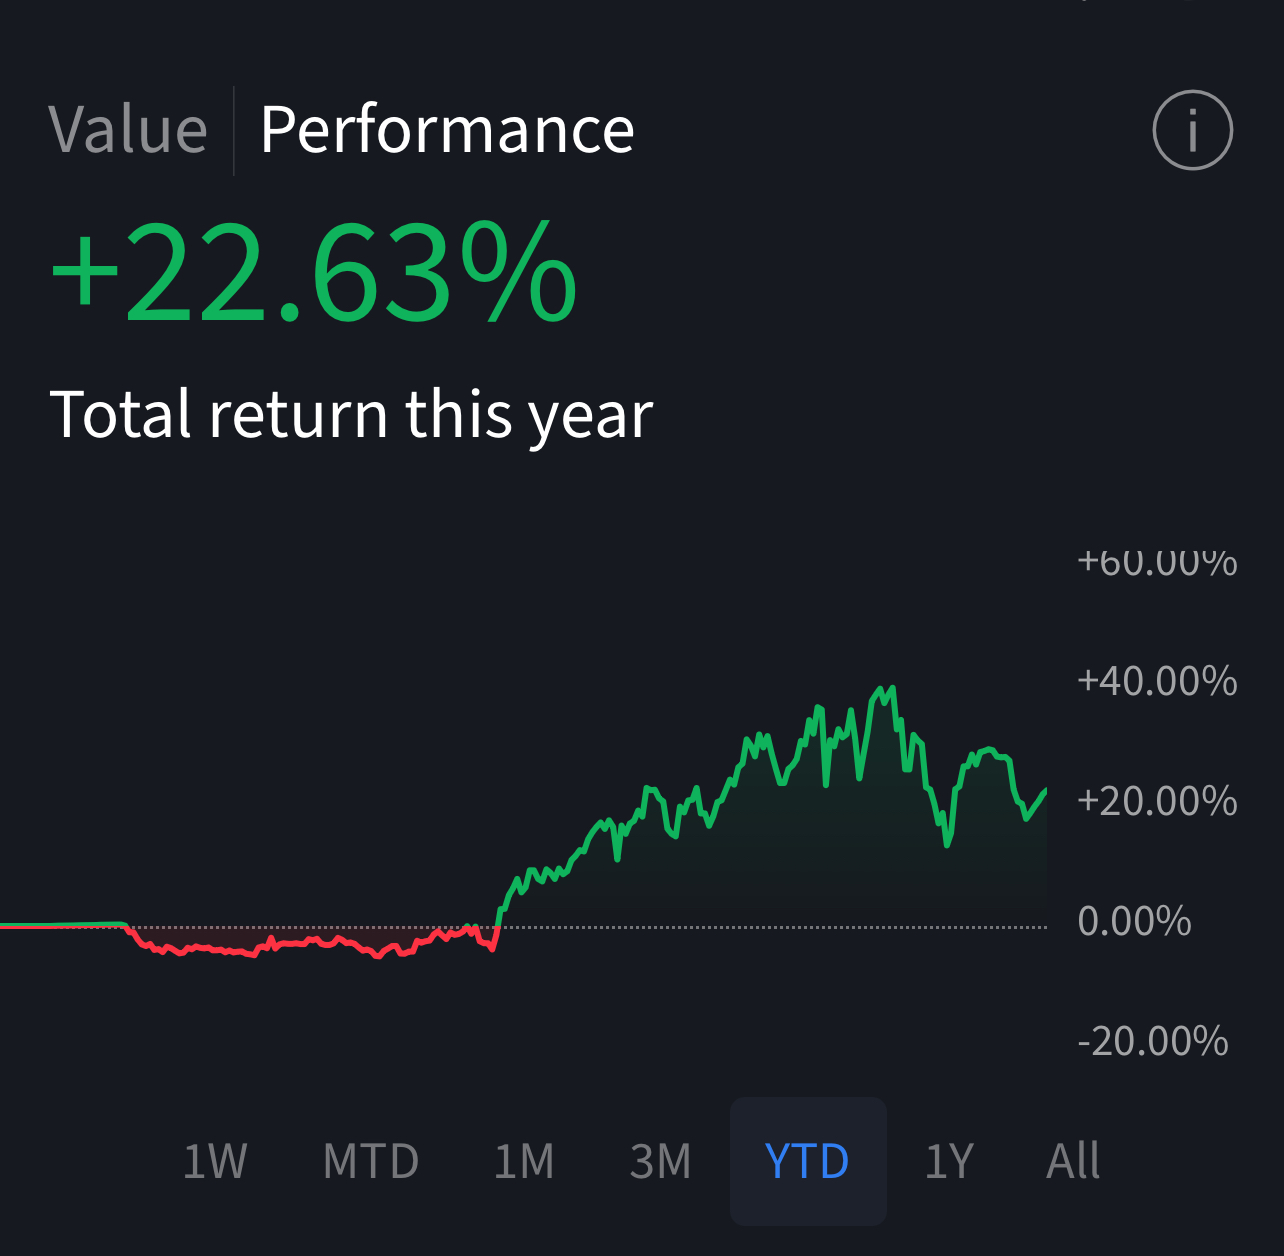
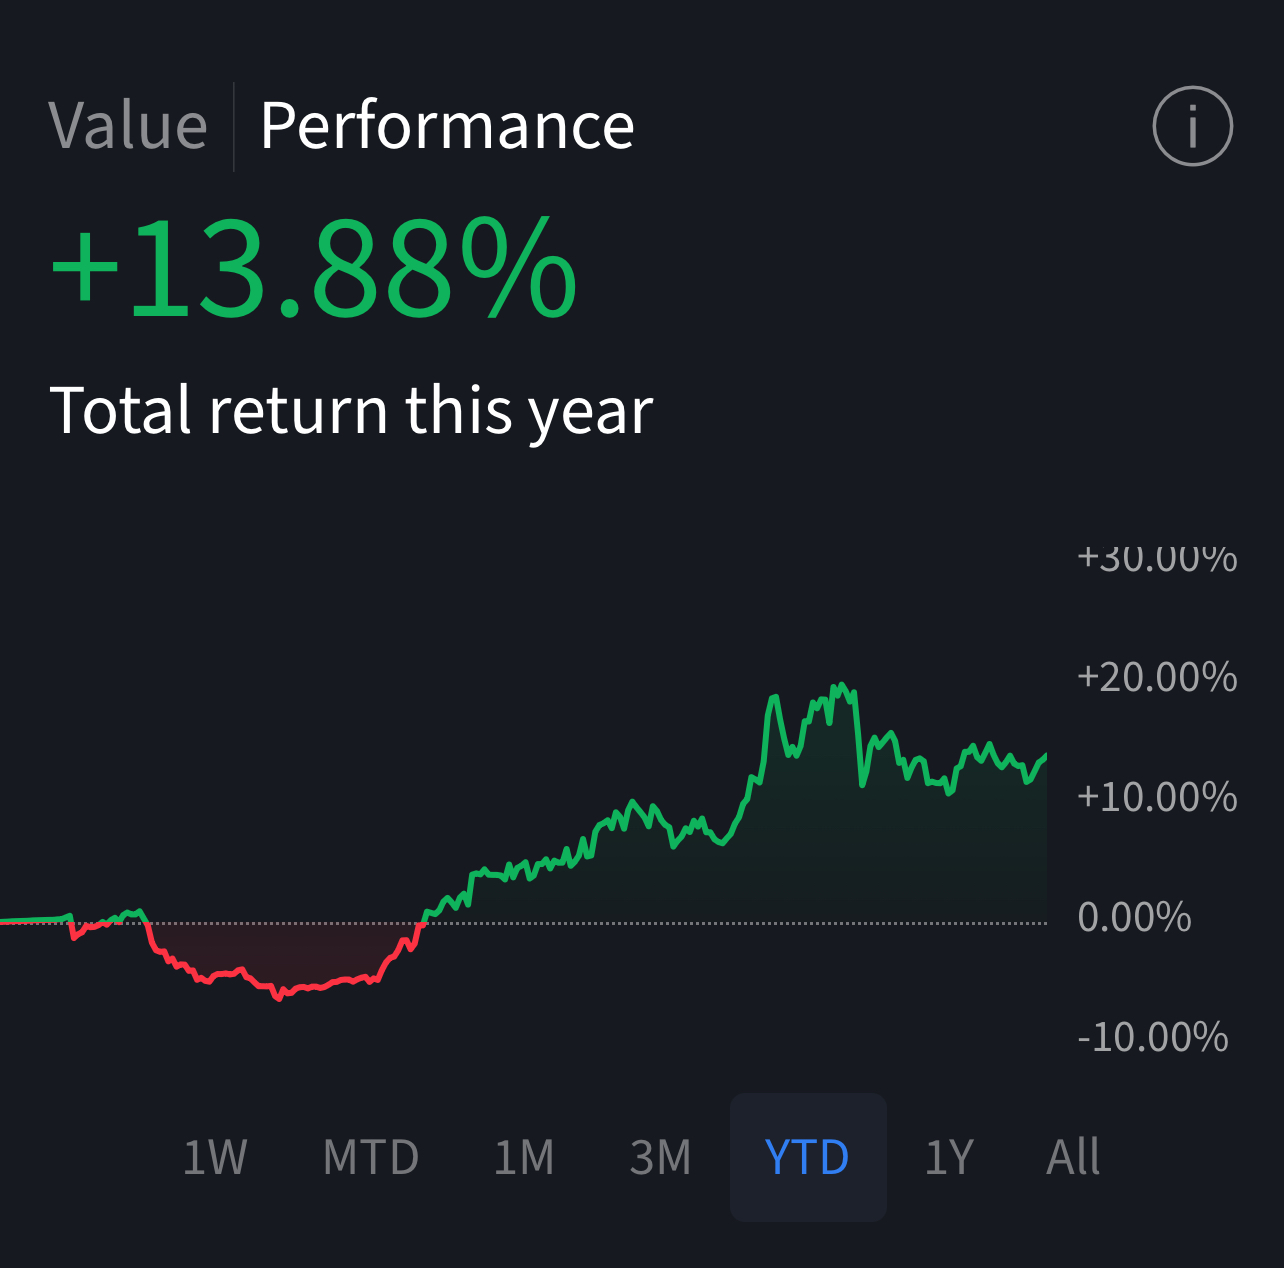
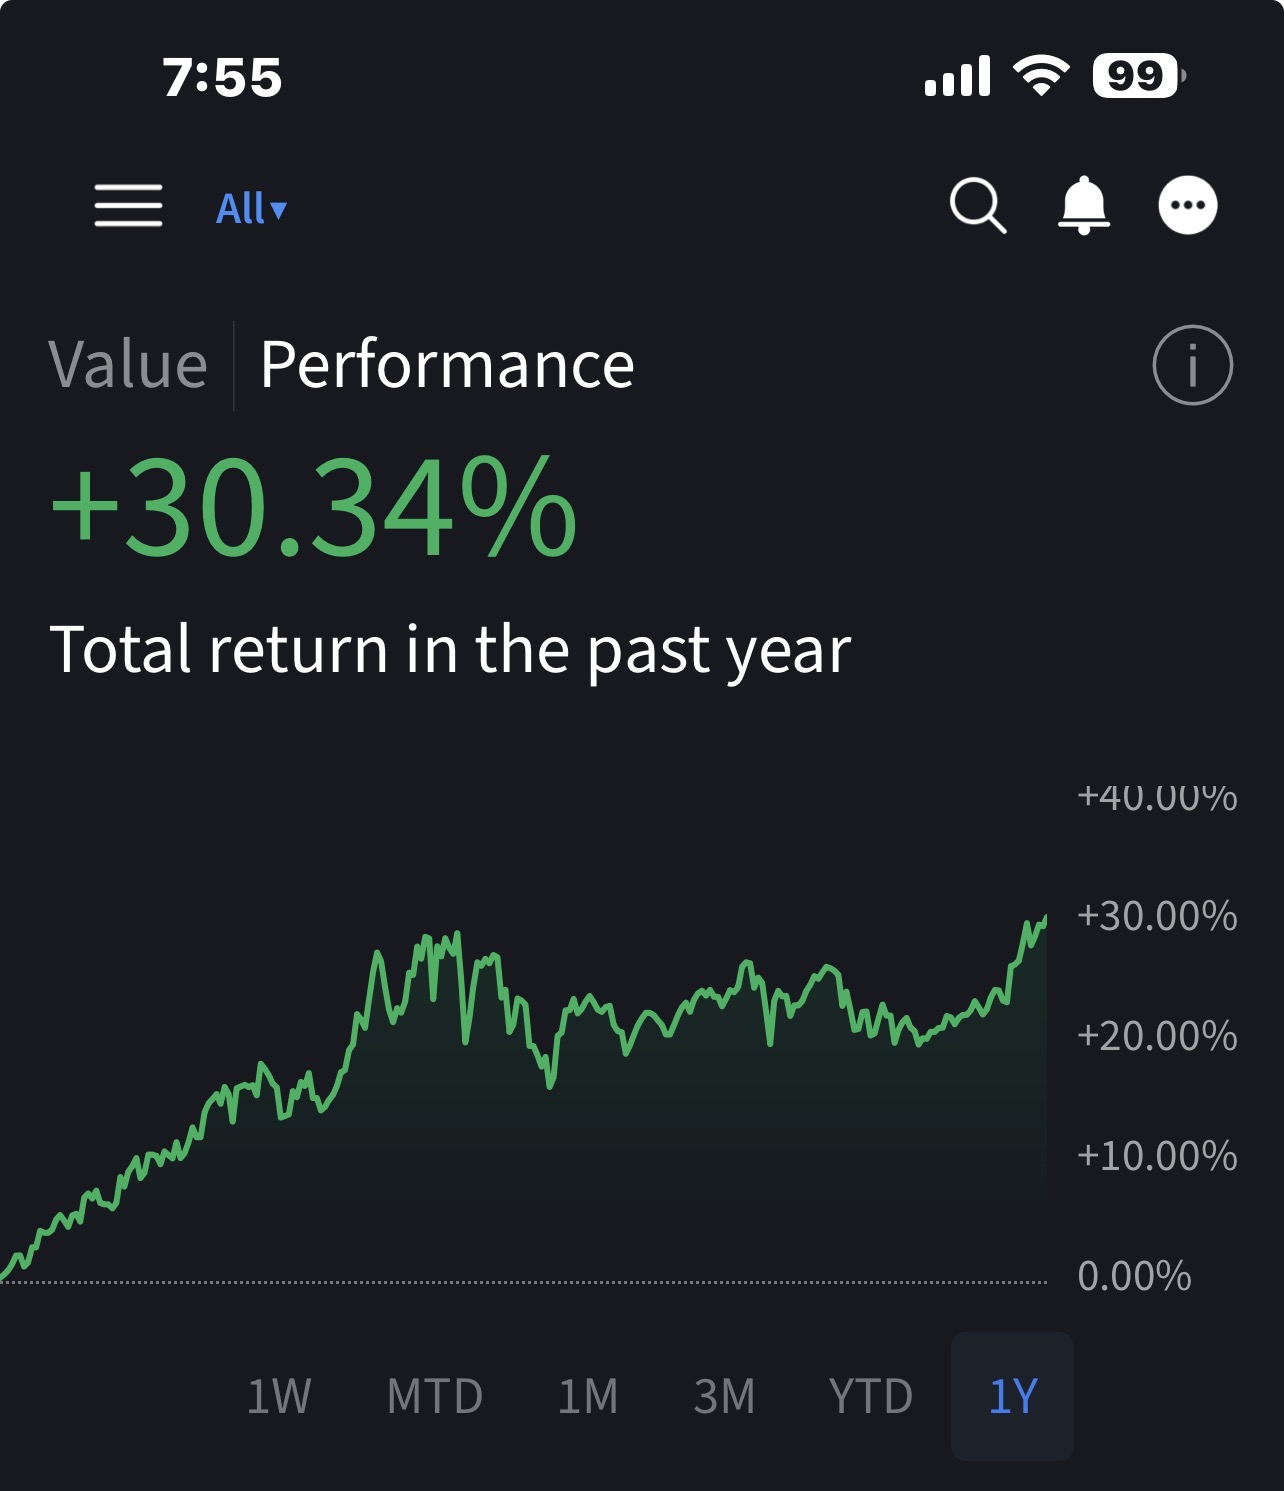
As promised here is an updated progress report on my live trading of the systems I designed in me TMSElite mentorshio with Laurens. Today is exactly eleven months since I went live with my two accounts at IBKR. One is my IRA account, and one is in my regular brokerage account (taxable) below are screen shots from my IBKR Phone App showing today's YTD performance at market close.
The first image (22%) is the tax account, the second image (13%) is the IRA account.
As always if anyone wants to contact me to discuss the systems or my experience in the mentorship you can reach me on discord.
wayne_51751
Wishing a Merry Santa Claus rally to you all. :)
Here we are, two months into 2026 already. Here is my one year performance of my live trading of my suites I developed in the mentorship. 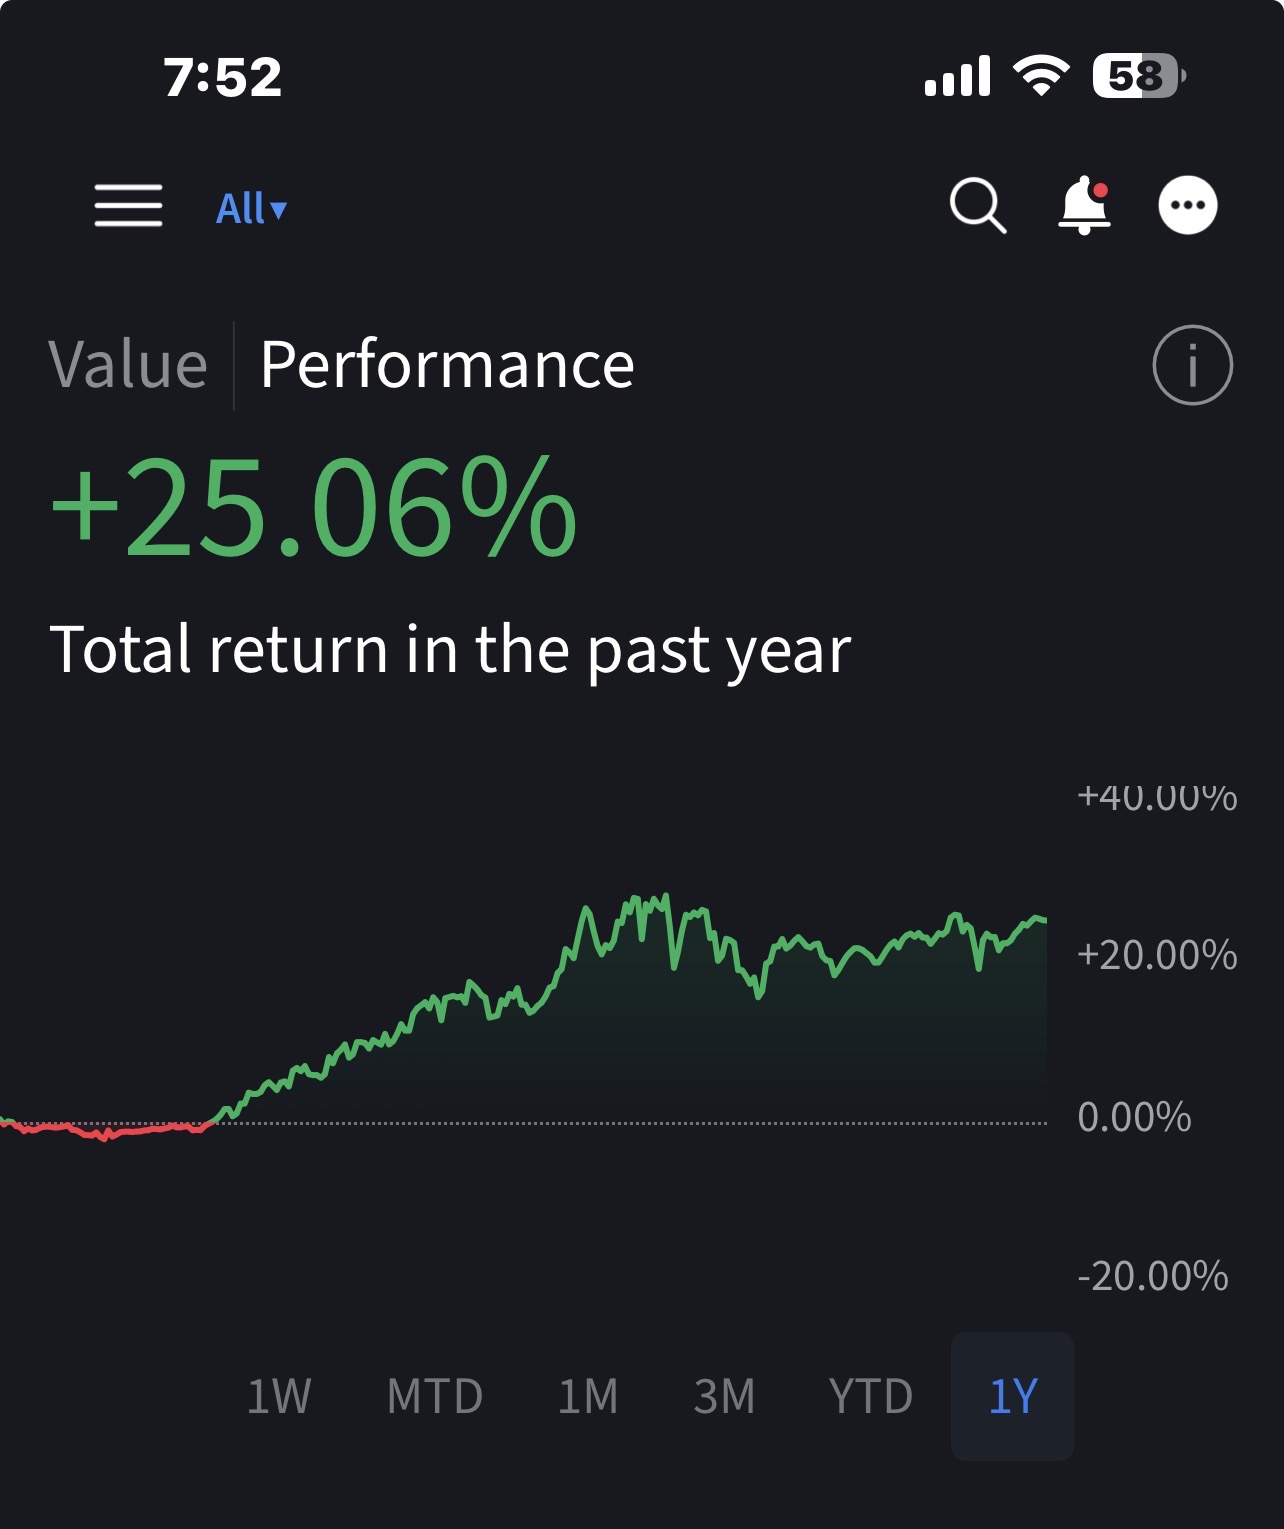
I’ll post another update at the end of April. If anyone has questions about how Bensdorp’s mentorship works, what my experience was as a student, and how my ongoing automated systematic trading has been going for the last 14 months you can contact me on discord
wayne_51751
wayne_51751
A little late for the end of April. :) Here we are as of May 13. As always, anyone who wants to contact me for discussion can contact me on Discord (see above)
@wcjarvis
I just joined Discord & sent you a friend invite. Like many, i have some questions for you about the training/mentoring program and your hardware/software stack. Hope you will accept & reach out.
Henk
I just joined Discord & sent you a friend invite. Like many, i have some questions for you about the training/mentoring program and your hardware/software stack. Hope you will accept & reach out.
Henk
Hi Henk,
I accepted your request, we can chat on discord whenever you like.
@dma I responded to your friend request on Discord last week. If you are still interested in chatting let me know.
Your Response
Post
Edit Post
Login is required