Plot Style Extension API
This document details the API for building Plot Style Extensions for Wealth-Lab 8. A Plot Style determines how a time series (such as an indicator) is plotted is plotted on a WL8 chart. Common Plot Styles include:
- Line
- Histogram
- Dots
Build Environment
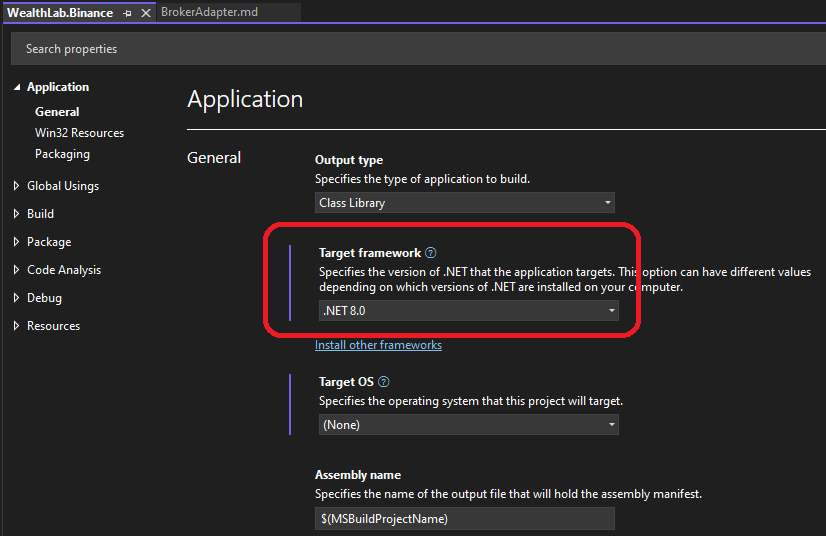
You can create a Plot Style in a .NET development tool such as Visual Studio 2022.
Create a class library project that targets .NET8, then reference the WealthLab.ChartWPF library DLL that you'll find in the WL8 installation folder.
Note: If you are using Visual Studio 2022, it will need to be updated to at least version 17.8.6 to use .NET8.
Your Plot Style will be a class in this library that descends from SeriesStyleBase, which is defined in the WealthLab.ChartWPF library, in the WealthLab.ChartWPF namespace. After you implement and build your library, simply copy the resulting assembly DLL into the WL8 installation folder. The next time WL8 starts up, it will discover your Plot Style, making it available in appropriate locations of the WL8 user interface.
SeriesStyleBase is derived from the PlotBase base class. Consult the PlotBase class reference for properties and methods available to SeriesStyleBase.
Accessing the Host (WL8) Environment
The IHost interface allows your extension to access information about the user's WealthLab environment. For example, the location of the user data folder, or obtaining a list of DataSets defined by the user. At any point in your extension's code base, you can access an instance of the IHost interface using the singleton class WLHost and its Instance property. Example:
//get user data folder
string folder = WLHost.Instance.DataFolder;
Descriptive Properties and Parameters
The SeriesStyleBase class is ultimately derived from the Configurable base class. Configurable contains property that let you describe the Name of your Plot Style, and the GlyphResource that should be used for its icon. See the Configurable class reference for details on these properties.
public virtual void GenerateParameters()
Since SeriesStyleBase derives from Configurable, it supports Parameters that can be modified by the user. You can override the GenerateParameters method to install new Parameters specific to your Plot Style.
public WLColor Color
The SeriesStyleBase constructor adds a Parameter instance labeled Color to the Parameters list. The Color property's getter accessor method reads the value from this Parameter, and the setter sets the value of this Parameter.
For this reason, if you want to use the Color property in your Plot Style, take care to not remove this Color Parameter instance. The best way to ensure this is, assuming you are adding more Parameter instances via GenerateParameters, is to call base.GenerateParameters before adding your new ones.
Accessing the CoreChart Instance
public CoreChart Chart
This property is inherited from the PlotBase parent class and returns an instance of the underlying chart component (an instance of the CoreChart class) that your Plot Style is rendering to. You'll need to access several important properties of the Chart instance as you develop a Plot Style. Most notable are the StartIndex and EndIndex properties. These will be referenced in the Render method, and they return the first and last indices within the BarHistory that are being charted.
Accessing the Source Data
public TimeSeries Series
Returns the instance of the TimeSeries class that represents the data being plotted by your Plot Style. You can be sure that the TimeSeries has a number of DateTimes and Values equal to that of the BarHistory being charted (Chart.Bars property).
Rendering the Plot Style
public abstract void Render(DrawingContext dc)
Override this method to render your Plot Style onto the WPF DrawingContext passed in the dc parameter. The typical implementation does the following:
- Loop through the bars in the BarHistory being charted (accessible via the Bars property), starting at Chart.StartIndex and ending at Chart.EndIndex.
- Use the conversion methods provided by the PlotBase ancestor class to convert index values to x-pixel coordinates (ConvertIndexToX) and to convert price values to y-pixel coordinates (ConvertValueToY).
- Render each of the data points of the source Series within the visible range onto the DrawingContext using some of its drawing methods. Use the PenBrushFactory helper class to get instances of System.Windows.Media Pens and Brushes to use in your rendering.
public override WLColor GetBarColor(int idx)
This method returns the color that should be used to render a data point from the source Series. The default color returned is based on the Plot Style's Color property, but Strategy code can override plotted TimeSeries bar colors.
public virtual string OverridePlotPane
You can optionally override this method to return a "pane tag" specifying the chart pane that your Plot Style should be plotted to. You can return "Price" to plot in the price pane, and "Volume" to plot in the volume pane. One example where this property is used is in the BooleanDots Plot Style. Even though the Plot Style is based on an external data series, such as an indicator that might be plotted in its own pane, BooleanDots returns "Price" to ensure that the dots are always plotted in the price pane.
public override void RenderHighlight(DrawingContext dc)
This method is called when the user moves their mouse over your Plot Style, allowing you to perform some special rendering at that point. The default implementation plots a thick, translucent line.
public bool IsCompanionPlotted
Some indicators, such as Bollinger Bands and Keltner Bands, are composed of two individual indicators. Each of the indicators is considered the "companion" of the other. Certain Plot Styles, for example Bands, perform special rendering with the companion indicator in mind. IsCompanionPlotted returns true if the companion indicator was already rendered, allowing you to avoid having the special rendering performed twice. You can access the companion indicator by casting the Series property to an IndicatorBase instance, and then accessing the BandCompanion property of this instance.
Example
Presented below is the Line Plot Style in its entirely.
using WealthLab.Core;
using WealthLab.WPF;
using System.Windows;
using System.Windows.Media;

namespace WealthLab.ChartWPF
{
    public class LineSeriesStyle : SeriesStyleBase
    {
        //generate parameters - add a line thickness parameter
        public override void GenerateParameters()
        {
            base.GenerateParameters();
            Parameters.Add(new Parameter("Thickness", ParameterType.Int32, 2));
            Parameters.Add(new Parameter("Line Style", ParameterType.LineStyle, LineStyle.Solid));
        }

        //Name
        public override string Name => "Line";

        //glyph
        public override string GlyphResource => "WealthLab.ChartWPF.Glyphs.Line.png";

        //line thickness
        public int LineThickness
        {
            get
            {
                return Parameters.FindName("Thickness").AsInt;
            }
            set
            {
                Parameter p = Parameters.FindName("Thickness");
                p.DefaultValue = value;
                p.Value = value;
            }
        }

        //line style
        public LineStyle LineStyle
        {
            get
            {
                Parameter p = Parameters.FindName("Line Style");
                if (p == null)
                    return LineStyle.Solid;
                else
                    return p.AsLineStyle;
            }
            set
            {
                Parameter p = Parameters.FindName("Line Style");
                p.DefaultValue = value;
                p.Value = value;
            }
        }

        //render
        public override void Render(DrawingContext dc)
        {
            if (LineThickness <= 0)
                return;
            RenderLine(dc, Chart.StartIndex, Chart.EndIndex);
        }

        //render a line
        protected void RenderLine(DrawingContext dc, int startIdx, int endIdx)
        {
            //create geometry
            StreamGeometry sg = new StreamGeometry();
            StreamGeometryContext sgc = sg.Open();

            //get pen
            WLColor c = Color;
            Pen pen = PenBrushFactory.GetPen(c, LineThickness, LineStyle);

            //fast render if not custom colored
            if (Series.SeriesBarColors == null)
            {
                bool first = true;
                for (int n = startIdx; n <= endIdx; n++)
                {
                    if (Double.IsNaN(Series[n]))
                        continue;
                    if (n < Series.FirstValidIndex)
                        continue;
                    double xCoord = ConvertIndexToX(n);
                    double yData = ConvertValueToY(Series[n]);
                    if (first)
                    {
                        sgc.BeginFigure(new Point(xCoord, yData), false, false);
                        first = false;
                    }
                    else
                    {
                        sgc.LineTo(new Point(xCoord, yData), true, true);
                    }
                }
                RenderStreamingBarLine(sgc);
                sgc.Close();
                dc.DrawGeometry(null, pen, sg);
            }
            else
            {
                bool first = true;
                WLColor lastColor = WLColor.Empty;
                for (int n = startIdx; n <= endIdx; n++)
                {
                    if (Double.IsNaN(Series[n]))
                        continue;
                    if (n < Series.FirstValidIndex)
                        continue;
                    double xCoord = ConvertIndexToX(n);
                    double yData = ConvertValueToY(Series[n]);
                    c = GetBarColor(n);
                    Point pt = new Point(xCoord, yData);
                    if (c != lastColor)
                    {
                        if (!first)
                        {
                            sgc.LineTo(pt, true, true);
                            sgc.Close();
                            pen = PenBrushFactory.GetPen(lastColor, LineThickness, LineStyle);
                            dc.DrawGeometry(null, pen, sg);
                            sg = new StreamGeometry();
                            sgc = sg.Open();
                        }
                        sgc.BeginFigure(pt, false, false);
                        lastColor = c;
                        first = false;
                    }
                    else
                    {
                        sgc.LineTo(pt, true, true);
                    }
                }
                RenderStreamingBarLine(sgc);
                sgc.Close();
                pen = PenBrushFactory.GetPen(lastColor, LineThickness, LineStyle);
                dc.DrawGeometry(null, pen, sg);
            }
        }

        //render streaming bar portion of the line
        protected void RenderStreamingBarLine(StreamGeometryContext sgc)
        {
            if (LineThickness <= 0)
                return;

            if (Chart.ShouldStreamingBarBeRendered && !Double.IsNaN(Series.StreamingValue))
            {
                double xCoord = Chart.StreamingBarPlotX;
                double yCoord = ConvertValueToY(Series.StreamingValue);
                Point pt = new Point(xCoord, yCoord);
                sgc.LineTo(pt, true, true);
            }
        }
    }
}