Chart Style Extension API
This document details the API for building Chart Style Extensions for Wealth-Lab 8. A Chart Style determines how the open, high, low, close (OHLC) bars are rendered on the WL8 chart. Common Charts Styles include:
- Bar
- Candlestick
- Line
Build Environment
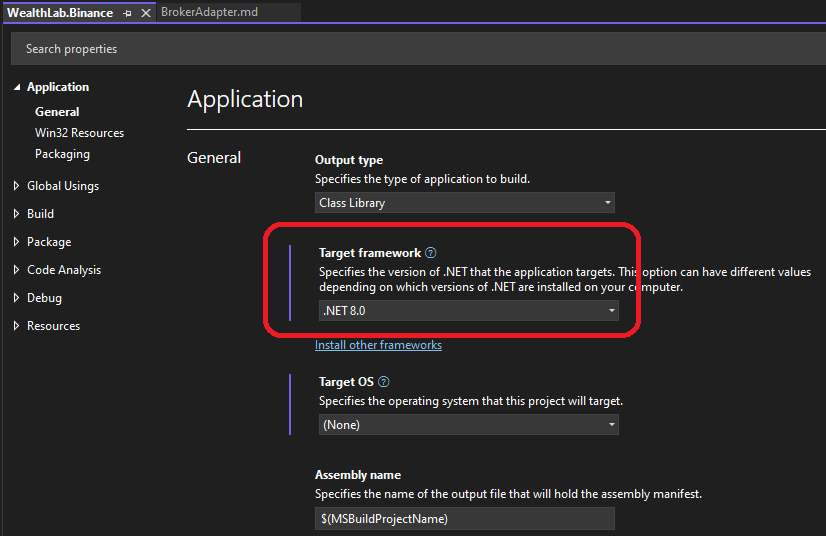
You can create a Chart Style in a .NET development tool such as Visual Studio 2022.
Create a class library project that targets .NET8, then reference the WealthLab.ChartWPF library DLL that you'll find in the WL8 installation folder.
Note: If you are using Visual Studio 2022, it will need to be updated to at least version 17.8.6 to use .NET8.
Your Chart Style will be a class in this library that descends from ChartStyleBase, which is defined in the WealthLab.ChartWPF library, in the WealthLab.ChartWPF namespace. After you implement and build your library, simply copy the resulting assembly DLL into the WL8 installation folder. The next time WL8 starts up, it will discover your Chart Style, making it available in appropriate locations of the WL8 user interface.
ChartStyleBase is derived from the PlotBase base class. Consult the PlotBase class reference for more properties and methods available to ChartStyleBase.
Accessing the Host (WL8) Environment
The IHost interface allows your extension to access information about the user's WealthLab environment. For example, the location of the user data folder, or obtaining a list of DataSets defined by the user. At any point in your extension's code base, you can access an instance of the IHost interface using the singleton class WLHost and its Instance property. Example:
//get user data folder
string folder = WLHost.Instance.DataFolder;
Configuration of a Chart Style
ChartStyleBase descends from the base class Configurable, which provides a way to allow the user to configure the Chart Style. Consult the Configurable class reference for details.
By default, ChartStyleBase assigns the ParameterListType value to its ConfigurableType property, so the Chart Style will use a ParameterList containing Parameter instances for configuration.
You'll define these Parameters in the GenerateParameters method, as described in the Configurable class reference.
Important Descriptive Properties
The Configurable class provides descriptive properties that control how your Chart Style appears in WL8. The most important ones to override are Name and GlyphResource.
Accessing the CoreChart Instance
public CoreChart Chart
This property is inherited from the PlotBase parent class, and returns an instance of the underlying chart component (an instance of the CoreChart class) that your Chart Style is rendering to. You'll need to access several important properties of the Chart instance as you develop a Chart Style. Most notable are the StartIndex and EndIndex properties that return the indices within the BarHistory being charted. These properties let you know the first bar number being charted along the left edge of the Chart, and the last bar number being charted along the right edge.
Initializing and Calculating Bar Width
public virtual void Initialize(BarHistory bars)
Override this method to perform any required initialization. WL8 calls your Chart Style's Initialize method whenever the BarHistory instance being charted changes. You are passed this instance in the bars parameter.
public virtual bool IsSimpleStyle
Your Chart Style can support fixed or variable bar width charts. The most common chart styles, including Candlestick, Bar, and Line, are all fixed width styles, where each bar of the chart is the same width, in pixels. More complex chart styles, such as Kagi and Point & Figure, are variable bar width. This means that each bar can have a differing width, in pixels, and some bars can even have a zero width.
If you are creating a fixed width Chart Style, let this property return its default value of false, and you can skip to the next section about rendering the chart. If you are creating a variable bar width Chart Style, return false and implement the following methods as well.
public virtual double GetBarWidth(int idx)
Return the width, in pixels, of the bar at index number idx. Returning a width of zero is valid for certain Chart Styles that render only a subset of the data.
public virtual int CalculateBarSpacings()
WL8 calls this method when the selected ChartPreferences bar spacing has changed, the underlying BarHistory being charted has changed, or the chart has scrolled. You might override this method to recalculate any internal data structures you're using to represent the internals of your Chart Style. After performing your Chart Style-specific logic, be sure to call base.CalculateBarSpacings. The base implementation sums up the bar widths starting along the right edge of the chart to determine the leftmost bar number that needs to be rendered.
Rendering the Chart Style
public abstract void Render(DrawingContext dc)
Override this method to render your Chart Style onto the WPF DrawingContext passed in the dc parameter. The typical implementation does the following:
- Loop through the bars in the BarHistory being charted (accessible via the Bars property), starting at Chart.StartIndex and ending at Chart.EndIndex
- Use the conversion methods provided by the PlotBase ancestor class to convert index values to x-pixel coordinates (ConvertIndexToX) and to convert price values to y-pixel coordinates (ConvertValueToY).
- Render each of the bars onto the DrawingContext using some of its drawing methods. Use the PenBrushFactory helper class to get instances of System.Windows.Media Pens and Brushes to use in your rendering.
public override WLColor GetBarColor(int idx)
This method returns the color that should be used to render the bar with the index of idx. The color depends on the selected ChartPreferences instance, and possible color changes initiated by Strategy code.
public virtual void RenderStreamingBar(DrawingContext dc)
Override this method to render the streaming partial bar onto the WPF DrawingContext passed in the dc parameter. Use the following Chart and Bars properties to determine where and how to render the streaming bar:
- Chart.StreamingBarColor
- Chart.StreamingBarPlotX
- Bars.StreamingBar (a BarData instance that contains the OHLC/V values of the streaming bar)
protected void RenderAsLine(DrawingContext dc)
You can call this method within Render to render the chart as a simple line style. The basic Chart Styles Candlestick and Bar do this when ChartPreferences.BarSpacing is <= 2. This logic allows the chart, when squeezed tight by the user, to collapse gracefully and improves rendering performance.
Example Code
Below is the full implementation of the Heikin-Ashi Chart Style.
using WealthLab.WPF;
using System.Windows;
using System.Windows.Media;
using WealthLab.Core;

namespace WealthLab.ChartWPF
{
    //heikin ashi chart style
    public class HeikinAshiChartStyle : ChartStyleBase
    {
        //name
        public override string Name => "Heikin Ashi";

        //it's a simple style
        public override bool IsSimpleStyle => true;

		//Glyph
        public override string GlyphResource => "WealthLab.ChartWPF.Glyphs.HeikinAshi.png";

		//The Glyph works as is in both Light and Dark Themes
        public override bool DisableGlyphReverse => true;

        //render the chart style
        public override void Render(DrawingContext dc)
        {
            if (ChartPreferences.BarSpacing <= 2 && !ChartPreferences.DisableRenderingOptimization)
            {
                RenderAsLine(dc);
                return;
            }
            BarHistory ha = HeikinAshi.Convert(Bars);
            Brush bkg = PenBrushFactory.GetBrush(ChartPreferences.ColorBackground);
            for (int n = Chart.StartIndex; n <= Chart.EndIndex; n++)
            {
                if (Double.IsNaN(ha.Close[n]))
                    continue;

                //determine color, override only if custom color not assigned
                WLColor c;
                if (ha.Close[n] >= ha.Open[n])
                    c = ChartPreferences.ColorUpBar;
                else
                    c = ChartPreferences.ColorDownBar;

                //render high/low line
                double xCoord = ConvertIndexToX(n);
                double yHigh = ConvertValueToY(ha.High[n]);
                double yLow = ConvertValueToY(ha.Low[n]);
                Pen pen = PenBrushFactory.GetPen(c, 1);
                dc.DrawLine(pen, new Point(xCoord, yHigh), new Point(xCoord, yLow));

                //determine width of candle
                double tickSize = ChartPreferences.BarSpacing / 2.0 - 1.0;
                if (tickSize < 1)
                    tickSize = 1;

                //render candle
                double yOpen = ConvertValueToY(ha.Open[n]);
                double yClose = ConvertValueToY(ha.Close[n]);
                double height = Math.Abs(yOpen - yClose);
                if (height < 1.0)
                    height = 1.0;
                double width = tickSize * 2.0;
                double x = xCoord - tickSize;
                if (ha.Close[n] >= ha.Open[n])
                {
                    Rect rect = new Rect(x, yClose, width, height);
                    dc.DrawRectangle(bkg, PenBrushFactory.GetPen(c, 1), rect);
                }
                else
                {
                    Rect rect = new Rect(x, yOpen, width, height);
                    dc.DrawRectangle(PenBrushFactory.GetBrush(c), null, rect);
                }
            }
        }
    }
}