Extension API
Build custom data providers, broker integrations, indicators, and more with the WealthLab extension framework.
Start with a working extension
Explore our extension demo project on GitHub for sample code and a head start on your own WealthLab extensions.
Indicator Library API
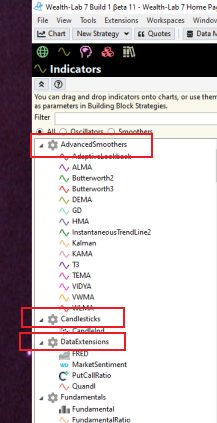
An Indicator Library Extension provides one or more Indicators that users can access throughout WealthLab 9. Indicators in your extension appear under their own node in the WealthLab Indicator tree and can be used in Charts, Building Block Strategies, C# Coded Strategies, and other WealthLab tools that work with Indicators.
Build Environment
You can create an Indicator in a .NET development tool such as Visual Studio 2026.
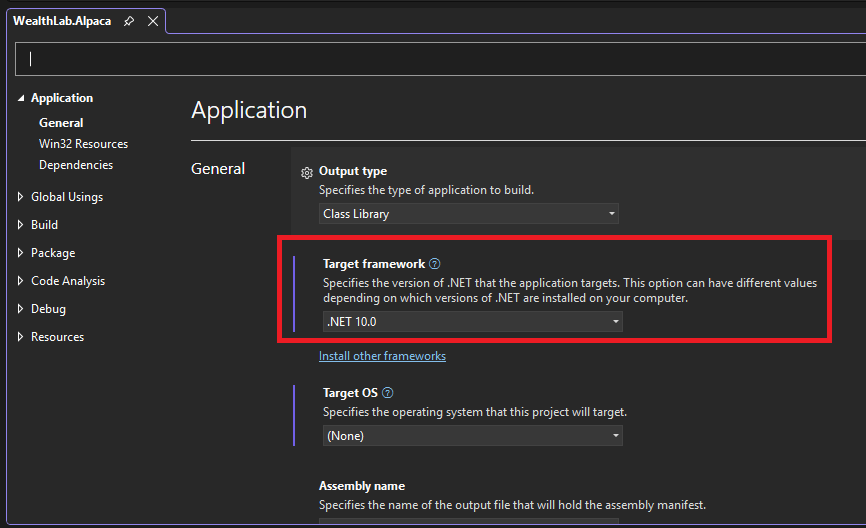
Create a class library project that targets .NET10, then reference the WealthLab.Core library DLL that you'll find in the WL9 installation folder.
Your Indicator will be a class in this library that descends from IndicatorBase, which is defined in the WealthLab.Core library, in the WealthLab.Indicators namespace. After you implement and build your library, simply copy the resulting assembly DLL into the WL9 installation folder. The next time WL9 starts up, it will discover your Indicator, making it available in appropriate locations of the WL9 user interface.
Accessing the Host (WL9) Environment
The IHost interface provides access to the current WealthLab environment. Extensions can use it to retrieve application-level information and services, such as the location of the user's WealthLab data folder or the DataSets defined by the user.
You can access the current IHost instance from anywhere in your extension through the WLHost singleton and its Instance property. For example, the following code retrieves the path to the user's WealthLab data folder:
string folder = WLHost.Instance.DataFolder;
Use WLHost.Instance whenever your extension needs access to functionality exposed by the IHost interface.
IndicatorBase Class
Each Indicator in your library should be implemented as a class derived from IndicatorBase, defined in the WealthLab.Indicators namespace. IndicatorBase has the following inheritance hierarchy:
DateSynchedList<double>
    TimeSeriesBase
        TimeSeries
            IndicatorBase
Because IndicatorBase ultimately derives from TimeSeries, an Indicator behaves like a time series and provides functionality such as DateTimes, Values, indexing, and mathematical operations.
Constructors
Each Indicator should provide at least two constructors. The first is a parameterless constructor:
public SMA() : base()
{
}
WealthLab uses the parameterless constructor to create lightweight Indicator instances when building its roster of available Indicators.
The second constructor should accept arguments corresponding to the Parameters defined by GenerateParameters. Assign the supplied arguments to the appropriate Parameter values and then call Populate to calculate the Indicator. For example:
public SMA(TimeSeries source, int period)
    : base()
{
    Parameters[0].Value = source;
    Parameters[1].Value = period;
    Populate();
}
Be sure to call the base constructor from each constructor you define.
Working with Parameters
Indicators expose their configurable inputs as Parameter instances.
Parameters
public ParameterList Parameters
Contains the Parameters that define the Indicator's inputs and settings.
GenerateParameters
protected virtual void GenerateParameters()
Override this method to define the Indicator's Parameters. Use the available helper methods to add Parameters to the Parameters collection. For example, SMA defines a source TimeSeries and an integer period:
protected override void GenerateParameters()
{
    AddParameter(
        "Source",
        ParameterType.TimeSeries,
        PriceComponent.Close);

    AddParameter(
        "Period",
        ParameterType.Int32,
        20);
}
AddParameter
protected Parameter AddParameter(
    string name,
    ParameterType type,
    object value)
Creates a Parameter using the supplied name, type, and default value, adds it to the Indicator's Parameters collection, and returns the new Parameter.
AddIndicatorParameter
protected Parameter AddIndicatorParameter(
    string name,
    string defaultValue)
Adds a Parameter that allows the user to select another Indicator as an input to your Indicator. The Parameter contains the selected Indicator along with the Parameters required to construct it. For example:
protected override void GenerateParameters()
{
    AddParameter(
        "Bars",
        ParameterType.BarHistory,
        null);

    AddIndicatorParameter(
        "Indicator",
        "ROC");
}
You can access the selected Indicator and its Parameters during Populate:
public override void Populate()
{
    BarHistory source =
        Parameters[0].AsBarHistory;

    DateTimes = source.DateTimes;

    Parameter p = Parameters[1];

    string indName =
        p.IndicatorAbbreviation;

    ParameterList indParams =
        p.IndicatorParameters;

    IndicatorBase ind =
        IndicatorFactory.Instance.CreateIndicator(
            indName,
            indParams,
            source);

    // Use ind here.
}
AddSmootherParameter
protected Parameter AddSmootherParameter(
    string name,
    string defaultValue)
Adds a Parameter that allows the user to select from the smoothing Indicators currently available in WealthLab. The resulting Parameter uses a StringChoice containing the available Indicators whose IsSmoother property returns true.
Descriptive Properties
Override the following properties to describe your Indicator to WealthLab and its users.
Name
public abstract string Name
Return the descriptive name of the Indicator. For example:
public override string Name =>
    "Simple Moving Average";
Abbreviation
public abstract string Abbreviation
Return the Indicator's abbreviation. The abbreviation should normally correspond to the Indicator's class name. For example:
public override string Abbreviation => "SMA";
HelpDescription
public abstract string HelpDescription
Return a short description explaining what the Indicator calculates. WealthLab displays this description when the user selects the Indicator in the Indicator tree.
Tooltip
public string Tooltip
Optionally assign text that WealthLab displays when the user hovers over the Indicator's value label on a chart.
HelpURL
public virtual string HelpURL
Optionally return a URL containing additional documentation about the Indicator.
Oscillators
public bool IsOscillator

public double OversoldLevel
public double OverboughtLevel
Assign non-NaN values to OversoldLevel and OverboughtLevel to identify the Indicator as an oscillator. When both levels are defined, IsOscillator returns true. WealthLab can use this information when filtering Indicators and in other features that treat oscillators specially.
IsSmoother
public virtual bool IsSmoother
Override this property and return true if the Indicator is a smoothing Indicator. Smoothers become available to features such as AddSmootherParameter and GetSmoothedIndicator. To function correctly as a standard smoother, an Indicator should have two Parameters:
- A TimeSeries source.
- An integer period.
LibraryName
public string LibraryName
Determines the node under which the Indicator appears in the Indicator tree. By default, WealthLab derives LibraryName from the name of your extension assembly. Assign a different value in the Indicator constructor if you want your Indicators grouped under another name.
Color and Plot Style
Indicators can define how they should be plotted by default when added to a chart.
PaneTag
public override string PaneTag
Return the chart pane in which the Indicator should normally be plotted. Common values include:
"Price"- Plot in the Price Pane, or in the same pane as the Indicator's target."Volume"- Plot in the Volume Pane.- A custom value, such as the Indicator's Abbreviation, to plot the Indicator in its own pane.
For example:
public override string PaneTag => "Price";
DefaultColor
public virtual WLColor DefaultColor
Override this property to specify the Indicator's default plot color.
Multi-Color Indicators
An Indicator can assign a different color to individual values using its SeriesBarColors collection. Initialize SeriesBarColors after assigning DateTimes, and then assign a WLColor for each desired bar. For example:
public override void Populate()
{
    BarHistory bars =
        Parameters[0].AsBarHistory;

    int length =
        Parameters[1].AsInt;

    int length2 =
        Parameters[2].AsInt;

    DateTimes = bars.DateTimes;

    TimeSeries values =
        SMA.Series(bars.Close, length) -
        SMA.Series(bars.Close, length2);

    SeriesBarColors =
        new DateSynchedList<WLColor>(
            DateTimes,
            DefaultColor);

    for (int n = 0; n < bars.Count; n++)
    {
        Values[n] = values[n];

        if (n == 0)
            continue;

        if (values[n] > 0)
        {
            SeriesBarColors[n] =
                values[n] > values[n - 1]
                    ? DefaultColor
                    : WLColor.Blue;
        }
        else if (values[n] < 0)
        {
            SeriesBarColors[n] =
                values[n] < values[n - 1]
                    ? WLColor.Red
                    : WLColor.Yellow;
        }
    }
}
The Indicator's DefaultColor, or the color selected when it is plotted, is still used for its chart label even when SeriesBarColors controls the individual plotted values.
DefaultPlotStyle
public virtual PlotStyles DefaultPlotStyle
Override this property to specify the default way WealthLab should render the Indicator. Available PlotStyles include:
- Line
- Histogram
- Dots
- ThickLine
- ThickHistogram
- DottedLine
- DashedLine
- BooleanDots - Renders dots above or below chart bars when the Indicator value is greater than zero.
- Bands - Renders an optionally filled band using a companion Indicator.
- ZigZag - Intended for sparse values separated by
Double.NaN. - Blocks - Commonly used for historical event data.
- GradientBlocks - Similar to Blocks, with gradient-based rendering.
- BarHistory - Used internally when plotting a secondary BarHistory.
- BarChart - Plots the Indicator as OHLC bars and requires GetBarChartCompanion.
- HistogramTwoColor - Colors histogram bars according to whether the corresponding price bar was up or down.
DefaultPlotName
public virtual string DefaultPlotName
Returns the name of the Plot Style WealthLab should use to render the Indicator. The default implementation maps DefaultPlotStyle to the corresponding built-in Plot Style. Override DefaultPlotName if your Indicator should use a custom Plot Style implemented as a SeriesStyleBase extension. See the Plot Style Extension documentation for more information.
GetBarChartCompanion
public virtual IndicatorBase GetBarChartCompanion(
    PriceComponents pc)
If your Indicator uses the BarChart Plot Style, override this method to provide the companion Indicator representing the requested OHLC component. The pc parameter indicates which PriceComponents series WealthLab is requesting.
UseZeroOrigin
public virtual bool UseZeroOrigin
Override this property and return true to force the Indicator's chart pane to include zero as the origin of its y-axis.
Populating an Indicator
Populate
public abstract void Populate()
Override Populate to calculate the Indicator's values. Begin by obtaining the configured Parameter values and storing them in local variables. An Indicator normally has a source Parameter, typically a TimeSeries or BarHistory. Because IndicatorBase derives from TimeSeries, assign the Indicator's DateTimes from the source:
DateTimes = source.DateTimes;
This synchronizes the Indicator with its source and initializes its Values with Double.NaN. You can then calculate and assign values by index:
DateTimes = source.DateTimes;

for (int n = 0; n < source.Count; n++)
{
    double val =
        (source.High[n] + source.Low[n]) / 2.0;

    Values[n] = val;
}
You can also use WealthLab's TimeSeries math to calculate an entire series:
DateTimes = source.DateTimes;

TimeSeries avg =
    (source.High + source.Low) / 2.0;

Values = avg.Values;
GetSmoothedIndicator
protected IndicatorBase GetSmoothedIndicator(
    string name,
    TimeSeries source,
    int period)
Creates and returns a smoothed version of source using the smoothing Indicator identified by name and the specified period.
Static Series Method
Indicators should provide a static Series method that constructs and returns an Indicator instance. The standard Series implementation uses the source TimeSeriesBase Cache so that repeated requests for the same Indicator and Parameters reuse an existing instance instead of recalculating it. For example:
public static SMA Series(
    TimeSeries source,
    int period)
{
    string key =
        CacheKey("SMA", period);

    if (source.Cache.ContainsKey(key))
        return (SMA)source.Cache[key];

    SMA sma =
        new SMA(source, period);

    source.Cache[key] = sma;

    return sma;
}
The Series method:
- Generates a cache key based on the Indicator and its Parameter values, excluding the source.
- Checks the source's Cache for an existing instance.
- Returns the cached Indicator when one exists.
- Otherwise creates the Indicator, stores it in the source Cache, and returns it.
This convention makes Indicators efficient and provides a consistent API for C# Coded Strategies. For example:
SMA sma = SMA.Series(bars.Close, 20);
CacheKey
public static string CacheKey(
    params object[] arguments)
Creates a cache key by combining the supplied arguments. Use this method when implementing your Indicator's static Series method.
Static Value Method
You can optionally provide a static Value method that calculates the Indicator's value at a specific source index. The conventional signature places the index first, followed by the source and any additional Indicator Parameters. For example:
public static double Value(
    int idx,
    TimeSeries source,
    int period)
{
    if (period <= 0 ||
        idx >= source.Count ||
        idx - period + 1 < 0)
    {
        return Double.NaN;
    }

    double sum = 0;

    for (int n = 0; n < period; n++)
        sum += source[idx - n];

    return sum / period;
}
A Value method is useful when callers need a single Indicator value without explicitly working with the complete Indicator series.
Streaming Partial Values
Indicators can optionally calculate a value for the current incomplete streaming bar.
public virtual bool CalculatePartialValue()
Override this method when your Indicator can calculate a value using its source's current StreamingValue. Assign the calculated result to the Indicator's StreamingValue property and return true when a valid partial value was calculated. Return false when a partial value cannot be calculated. For example, SMA implements:
public override bool CalculatePartialValue()
{
    StreamingValue = Double.NaN;

    TimeSeries source =
        Parameters[0].AsTimeSeries;

    if (Double.IsNaN(source.StreamingValue))
        return false;

    int period =
        Parameters[1].AsInt;

    if (period >= source.Count)
        return false;

    double sum = 0;

    for (int n = 0; n < period - 1; n++)
    {
        int i =
            source.Count - 1 - n;

        sum += source[i];
    }

    sum += source.StreamingValue;

    StreamingValue =
        sum / period;

    return true;
}
Band Indicators
Indicators that represent upper and lower bands can use the Bands Plot Style.
BandCompanionAbbreviation
public virtual string BandCompanionAbbreviation
Override this property to return the Abbreviation of the Indicator representing the other side of the band. For example, an upper Bollinger Band Indicator might return:
public override string BandCompanionAbbreviation =>
    "BBandLower";
and the lower band would return "BBandUpper".
BandCompanion
public virtual IndicatorBase BandCompanion
Returns the companion Indicator used when plotting the band. The default implementation creates the companion based on BandCompanionAbbreviation and the current Indicator's Parameters. Override this property if your band requires custom logic to create its companion.
Indicator Companions
public virtual List<string> Companions
Override this property when it is useful to plot one or more additional Indicators along with your Indicator. Return a list containing the Abbreviations of the companion Indicators. When the user adds your Indicator to a chart, WealthLab can offer to automatically plot these companions as well.
Complete Example: SMA
The following example shows the complete implementation of the Simple Moving Average Indicator.
using WealthLab.Core;

namespace WealthLab.Indicators
{
    public class SMA : IndicatorBase
    {
        // Parameterless constructor
        public SMA() : base()
        {
        }

        // Code-based construction
        public SMA(
            TimeSeries source,
            int period)
            : base()
        {
            Parameters[0].Value = source;
            Parameters[1].Value = period;

            Populate();
        }

        // Cached Series method
        public static SMA Series(
            TimeSeries source,
            int period)
        {
            string key =
                CacheKey("SMA", period);

            if (source.Cache.ContainsKey(key))
                return (SMA)source.Cache[key];

            SMA sma =
                new SMA(source, period);

            source.Cache[key] = sma;

            return sma;
        }

        // Name
        public override string Name =>
            "Simple Moving Average";

        // Abbreviation
        public override string Abbreviation =>
            "SMA";

        // Description
        public override string HelpDescription =>
            "Simple average of a range of values.";

        // Plot in the Price Pane
        public override string PaneTag =>
            "Price";

        // SMA is a smoother
        public override bool IsSmoother =>
            true;

        // Calculate values
        public override void Populate()
        {
            TimeSeries source =
                Parameters[0].AsTimeSeries;

            int period =
                Parameters[1].AsInt;

            DateTimes =
                source.DateTimes;

            if (period <= 0)
                return;

            for (int n = period - 1;
                n < source.Count;
                n++)
            {
                Values[n] =
                    SMA.Value(
                        n,
                        source,
                        period);
            }
        }

        // Calculate an ad-hoc SMA value
        public static double Value(
            int idx,
            TimeSeries source,
            int period)
        {
            if (period <= 0 ||
                idx >= source.Count ||
                idx - period + 1 < 0)
            {
                return Double.NaN;
            }

            double sum = 0;

            for (int n = 0;
                n < period;
                n++)
            {
                sum += source[idx - n];
            }

            return sum / period;
        }

        // Calculate partial streaming value
        public override bool CalculatePartialValue()
        {
            StreamingValue = Double.NaN;

            TimeSeries source =
                Parameters[0].AsTimeSeries;

            if (Double.IsNaN(
                source.StreamingValue))
            {
                return false;
            }

            int period =
                Parameters[1].AsInt;

            if (period >= source.Count)
                return false;

            double sum = 0;

            for (int n = 0;
                n < period - 1;
                n++)
            {
                int i =
                    source.Count - 1 - n;

                sum += source[i];
            }

            sum +=
                source.StreamingValue;

            StreamingValue =
                sum / period;

            return true;
        }

        // Define parameters
        protected override void GenerateParameters()
        {
            AddParameter(
                "Source",
                ParameterType.TimeSeries,
                PriceComponent.Close);

            AddParameter(
                "Period",
                ParameterType.Int32,
                20);
        }
    }
}
Need help developing an extension?
Ask the WealthLab community or work with our team on a custom solution.