I'm using the (WL.com) OneNight strategy and trying to understand how WL selects positions to take (and not take) in non-sufficient funds situations. Here's the scenarios:
No NSF
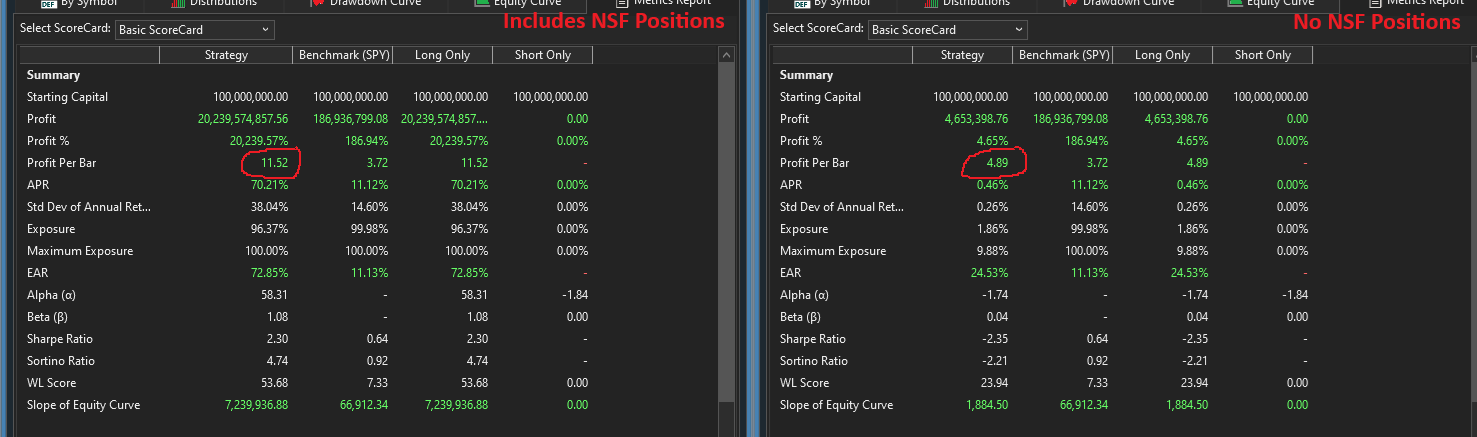
- Run the strategy with position sizing such that there will be no NSF positions. I do this by selecting % of equity with a value of 0.2. This allows for 500 positions which matches the count of symbols in the dataset being backtested. OneNight hold positions for 1 bar then closes at market.
NSF
-Run the same strategy with position sizing such that some positions will not have sufficient funds. I do this by selecting % of equity with a value of 10. This allows for 10 concurrent positions to be taken.
The "No NSF" scenario returns a much lower profit per bar as compared to the backtest that includes NSF positions, and I'm not understanding why this would be the case. In cases where more positions are available to be take than funds available, I expected the taken position to be random. That does not appear to be the case unless I'm missing something. If this was random, the performance of both scenarios should be identical given enough tests. I'm seeing the "NSF" scenario return 3x or great profit per bar after many tests.
Nothing else was changed in the above 2 scenarios. Same dataset, same margin (none), etc. The only variable that changed is the % of equity value; 0.2 vs 10.
Somehow, the backtest that has a position sizing such that NSF positions will exist is consistently returning a much higher profit per bar. I would like to understand this because it is the root issue that is preventing me from implementing a similar strategy.
I'm using PPB because it is normalize allowing direct comparison.

Note: I set the initial capital to 100MM to ensure the 0.2 % of equity setting did not cause any NSF. This is confirmed in the metrics report; NSF = 0.
What am I missing?
No NSF
- Run the strategy with position sizing such that there will be no NSF positions. I do this by selecting % of equity with a value of 0.2. This allows for 500 positions which matches the count of symbols in the dataset being backtested. OneNight hold positions for 1 bar then closes at market.
NSF
-Run the same strategy with position sizing such that some positions will not have sufficient funds. I do this by selecting % of equity with a value of 10. This allows for 10 concurrent positions to be taken.
The "No NSF" scenario returns a much lower profit per bar as compared to the backtest that includes NSF positions, and I'm not understanding why this would be the case. In cases where more positions are available to be take than funds available, I expected the taken position to be random. That does not appear to be the case unless I'm missing something. If this was random, the performance of both scenarios should be identical given enough tests. I'm seeing the "NSF" scenario return 3x or great profit per bar after many tests.
Nothing else was changed in the above 2 scenarios. Same dataset, same margin (none), etc. The only variable that changed is the % of equity value; 0.2 vs 10.
Somehow, the backtest that has a position sizing such that NSF positions will exist is consistently returning a much higher profit per bar. I would like to understand this because it is the root issue that is preventing me from implementing a similar strategy.
I'm using PPB because it is normalize allowing direct comparison.
Note: I set the initial capital to 100MM to ensure the 0.2 % of equity setting did not cause any NSF. This is confirmed in the metrics report; NSF = 0.
What am I missing?
Rename
QUOTE:
The "No NSF" scenario returns a much lower profit per bar as compared to the backtest that includes NSF positions, and I'm not understanding why this would be the case.
That behavior is to be expected because you don't stay fully invested with the "No NSF" case. There will be times when a position will sell and there won't be another position to take its place right away.
Compare the Drawdown of the "No NSF" case verses the "Has NSF" case.
You can use transaction.Weight=?? to bias which position gets placed first in a Strategy Chart simulation, but not necessarily in a real-time Strategy Monitor execution. It's my understand Strategy Monitor's placement priority depends more on the broker behavior (in real-time) rather than the .Weight setting (during "simulation" time). But someone is welcome to correct me if I'm wrong.
I had the wild and crazy ideal to assign transaction.Weight Positions by their profitability once, but was told (indirectly) this may fail for Strategy Monitor execution. But you can still use the PreExecute{block} to create a Buy list of most desirable stocks to trade from that the Execute{block} can pick from so you're not just randomly picking from the dataset.
Doesn't profit per bar account for exposure differences?
If not, I have exported the positions from both scenarios. The average profit % per position is much higher in the "No NSF" scenario.
I guess my question is, how does WL select the positions to take when there are more qualified positions than funds available and no transaction weight factor has been set?
QUOTE:
Doesn't profit for bar account for exposure differences?
I stand corrected. I was thinking overall Profit, not Profit-per-Bar. But the "No NSF" case would have less exposure (drawdown).
I'm trying to decide if the "No NSF" case would have higher turnover, which might affect Profit-per-Bar? I think it might for certain strategies because you loose a little getting in and out of a position.
>>Doesn't profit for bar account for exposure differences?<<
Yes, here are two backtests that result in the same positions. The first backtest uses 10% of equity sizing, and the second one uses 30%. Notice the increased Profit in backtest 2 but the same Profit per Bar.

Yes, here are two backtests that result in the same positions. The first backtest uses 10% of equity sizing, and the second one uses 30%. Notice the increased Profit in backtest 2 but the same Profit per Bar.
I see the APRs are different, but when APR is corrected for exposure, the resulting EAR values are the same. Very interesting. Thanks for posting that. Now I understand why EAR is important.
The below video tries to demonstrate the NSF question I'm trying to understand.
https://leapfrogbi-my.sharepoint.com/:v:/p/paul/EZ4cRiTK_BNNvNco--4Ex8gBz5RqLPwFpcIvLBQZDeAmvw?e=OzncNe
Thank you again for the help.
https://leapfrogbi-my.sharepoint.com/:v:/p/paul/EZ4cRiTK_BNNvNco--4Ex8gBz5RqLPwFpcIvLBQZDeAmvw?e=OzncNe
Thank you again for the help.
Your thinking is correct and as a casual observation I also would expect the same. My recommendation is to do a smaller, more controlled test to verify the result. If a strategy doesn't assign Transaction Weight, we're sure that the selection is random and not forward looking, and, you can even inspect the weights for all Position (NSF included) yourself by adding a little code for each test:
Possible explanation -
The first test includes all the fat tails, but the other will most often not take on those fat tails given all the other candidates.
Possible explanation -
The first test includes all the fat tails, but the other will most often not take on those fat tails given all the other candidates.
Well, hmmm. I added this to the strategy and would have expected to verify on any given date that the Positions in the 25% of equity test are the first 4 Positions shown in this list by date... but that's not what I'm seeing.
Oh heck, nevermind.. These are all the transactions - not the trades that actually hit their limit.. stand by for another iteration.
Oh heck, nevermind.. These are all the transactions - not the trades that actually hit their limit.. stand by for another iteration.
CODE:
 retracted
That was a lot more thinking than I wanted to do this morning!
Here's the whole thing to work with and will give you a very clear behind-the scenes picture.
I think this actually reveals a problem - but it could still be a problem with my code...
Now the result is still random, but not in the way that I expect. I expect to always see "NSF:False" for the top positions each day if the positions were selected by highest weight. In many cases, it does work that way, but it is not consistent. We'll need to look closer!
Keep reading below... code above modified for the discussion.
Here's the whole thing to work with and will give you a very clear behind-the scenes picture.
CODE:
// TwoDays
using WealthLab.Backtest;
using System;
using WealthLab.Core;
using System.Linq;
using System.Collections.Generic;

namespace WealthScript4
{
    public class MyStrategy : UserStrategyBase
    {
        public override void Execute(BarHistory bars, int idx)
      {
         double percentage = 2.0;
         foreach (var pos in OpenPositions) ClosePosition(pos, OrderType.Market);
           double limit = bars.Close[idx] * (1.0 - percentage / 100.0);
         Transaction tr = PlaceTrade(bars, TransactionType.Buy, OrderType.Limit, limit);

        }
        public override void BacktestComplete()
        {
         // *** add: using System.Linq;
         var sorted = Backtester.TransactionLog.Where(x => x.IsEntry)   //filter for entries
                         .OrderBy(x => x.ExecutionDate)
                         .ThenByDescending(x => x.Weight)
                         .ToList();

         DateTime skipdate = DateTime.MaxValue;
         List<Position> positionsToday = [];

         foreach (Transaction t in sorted)
         {
            //WriteToDebugLog($"\t{t.EntryDate:yyyy-MM-dd}\t{t.ExecutionDate:yyyy-MM-dd}\t{t.Weight:N4}\t{t.BasisPrice:N2}\t{t.Symbol}");

            if (t.ExecutionDate != skipdate)
            {
               skipdate = t.ExecutionDate;
               positionsToday = Backtester.Positions.Where(x => x.EntryDate == t.ExecutionDate).ToList();
               WriteToDebugLog($"{t.ExecutionDate:yyyy-MM-dd} Positions Today: {positionsToday.Count}");
            }
            //WriteToDebugLog($"\t{t.Weight:N4}\t{t.BasisPrice:N2}\t{t.Symbol}");

            //output this Transaction if it resulted in a Position put on "today", NSF true or false
            foreach (Position p in positionsToday)
            {
               if (p.Symbol == t.Symbol)
               {
                  //add a "+" to indicate that the trade occurred at the open
                  int b = p.Bars.DateTimes.IndexOf(p.EntryDate);   // unsure if p.EntryBar can be used correctly in this context
                  string plus = t.BasisPrice >= p.Bars.Open[b] ? "+" : "";

                  WriteToDebugLog($"{plus}\t{t.Weight:N4}\t{t.BasisPrice:N2}\t{p.EntryPrice:N2}\tNSF:{p.NSF}\t{t.Symbol}");
                  break;
               }
            }
         }
      }
    }
}
Now the result is still random, but not in the way that I expect. I expect to always see "NSF:False" for the top positions each day if the positions were selected by highest weight. In many cases, it does work that way, but it is not consistent. We'll need to look closer!
Keep reading below... code above modified for the discussion.
Thank you so much for taking the time to look into this. I know how time consuming this can be.
I also thought that the long tail situation might explain this, but I carefully inspected each position (taken & not taken) in a smaller test. No outliers provided an explanation.
I also thought that the long tail situation might explain this, but I carefully inspected each position (taken & not taken) in a smaller test. No outliers provided an explanation.
If a trade opens below the limit it will get filled at a higher priority than another one with a higher weight. That might be why you’re seeing unexpected results?
Hi pfelix,
I think your results are valid. Here is a summary:
1. backtest results of limit order strategies when executed on EOD data show very different results depending on position sizes.
2. If position size is small enough and there are no NSF positions (all possible entry orders are actually executed) the results are rather bad. This shows the merit of the trading logic.
3. If position size is high, WL chooses the trades randomly. This results in much better results.
4. Average profit per trade is an excellent metric to quantify this effect.
While this looks like a bug in the software I can assure you: The software is correct, all results are correct, the effect has a somewhat convoluted explanation.
First of all, to research the topic further, intraday data is required. I used 1-Min data form EODHD for everything that follows.
Then I used the ScottPlot Library along with the InteractiveGraphics extension to produce the following plots. The basic trading strategy used is OneNight, but similar results can be generated for all limit order strategies.
I used a portfolio of 34 symbols and a data range of 5 years.
After some experimentation I found out, that it is important to consider the number of entries per day. Here the resulting plot:

The plot shows number of Entries on the X-Axis and average profit of all trades on such a day on the Y-Axis.
It is obvious, that there are positive profits as long as there are less than 18 Entries per day.
If a day sees much more entries, the average profits are negative (!).
From here on, I concentrated on days with more than 16 entries.
The next plot shows average profit of all trades that are entered at a specific time during the day:

The plot has entry time on the X-Axis and average profit on the Y-Axis.
Every trade is a blue dot.
The centered moving average is shown as a red line.
It becomes clear, that the early trades are much worse than later trades.
And finally the question: How many trades happen at which time?
Here is a plot that answers that question:

Again, X-Axis shows entry time, Y-Axis shows number of entries.
The result: If there are more than 16 entries on a single day, then most entries happen towards the start of the day, much fewer trades happen later.
I think your results are valid. Here is a summary:
1. backtest results of limit order strategies when executed on EOD data show very different results depending on position sizes.
2. If position size is small enough and there are no NSF positions (all possible entry orders are actually executed) the results are rather bad. This shows the merit of the trading logic.
3. If position size is high, WL chooses the trades randomly. This results in much better results.
4. Average profit per trade is an excellent metric to quantify this effect.
While this looks like a bug in the software I can assure you: The software is correct, all results are correct, the effect has a somewhat convoluted explanation.
First of all, to research the topic further, intraday data is required. I used 1-Min data form EODHD for everything that follows.
Then I used the ScottPlot Library along with the InteractiveGraphics extension to produce the following plots. The basic trading strategy used is OneNight, but similar results can be generated for all limit order strategies.
I used a portfolio of 34 symbols and a data range of 5 years.
After some experimentation I found out, that it is important to consider the number of entries per day. Here the resulting plot:
The plot shows number of Entries on the X-Axis and average profit of all trades on such a day on the Y-Axis.
It is obvious, that there are positive profits as long as there are less than 18 Entries per day.
If a day sees much more entries, the average profits are negative (!).
From here on, I concentrated on days with more than 16 entries.
The next plot shows average profit of all trades that are entered at a specific time during the day:
The plot has entry time on the X-Axis and average profit on the Y-Axis.
Every trade is a blue dot.
The centered moving average is shown as a red line.
It becomes clear, that the early trades are much worse than later trades.
And finally the question: How many trades happen at which time?
Here is a plot that answers that question:
Again, X-Axis shows entry time, Y-Axis shows number of entries.
The result: If there are more than 16 entries on a single day, then most entries happen towards the start of the day, much fewer trades happen later.
"If a trade opens below the limit it will get filled at a higher priority than another one with a higher weight. That might be why you’re seeing unexpected results?"
This is a very important and it aligns with what DrKoch found related to when trades typically happen. I felt like something similar was happening and altered my strategy to exclude the first 30 minutes of the day. So far my results are unconclusive, but I'm trying to use this to explain this situation.
Since WL will prioritize symbols that open below the limit price over those with a higher (random) weight, I would expect those trades that are taken due to the higher priority to have a much higher return than randomly taken orders. I'll work on this to see if it explains the issue.
It looks like DrKoch already did the work above, but it will be interesting to see if you corroborate it.
Code updated in Post #9 to indicate trades that occurred on the open.
Now we're all smarter!
Now we're all smarter!
How do the plots in Post #12 answer our question?
Well, Plot#1 in Post #12 suggests a partial explanation:
On days with just a few trades, all these trades have a positive average profit.
On "busy" days (more than 16 entries), the average profit tends to be negative.
With a small position size all these trades are taken and the overall average profit tends to be zero. This explains why the OneNight strategy with a small position size (and therefore no NSF positions) shows rather bad results.
With large position sizes, the results for quiet days are unchanged. On "busy" days the large position size does not allow to take all the negative trades, hence the overall result is much better.
Plot#2 of Post #12 explains why real trading results are even worse:
On a "busy" day, in real trading the first/early trades are entered while there remains no capital for later trades. Plot#2 suggests that these early trades are much worse than later trades.
And again: WL's backtester will choose trades randomly and therefore tends to skip the early trades. This explains why randomly chosen trades on a "busy" day lead to much better results than trades taken in the correct sequence (early trades first).
How can we use all this knowledge to improve a limit order strategy?
Well, this is not quite straight forward.
The information above suggests a simple solution:
There is just a small difficulty: We simply don't know if the day will be a busy one before it had ended.
So: any suggestions are welcome!
Well, this is not quite straight forward.
The information above suggests a simple solution:
QUOTE:
Skip early trades (or all trades) on a "busy" day e.g. a day with more than 16 entries.
There is just a small difficulty: We simply don't know if the day will be a busy one before it had ended.
So: any suggestions are welcome!
And there is another consequence from this analysis:
* The results of limit order strategies run on EOD data are misleading.
* There are several subtle "peeking into the future" effects at work to produce these results.
* It is impossible to replicate these results in realtime trading
Conclusion: These results (in their present form) should not be advertised in the Top 5 of WL's home page.
I'd suggest to run limit order strategies with granular processing (or similar) before their results are published in the Top 5.
QUOTE:
With a small position size all these trades are taken
Before you ask how many entries (over all) happen on busy days, here a plot:

The bar plot has a bar/bucket for all the trading days with a specific number of entries (the X-Axis)
The Y-Axis shows the number of entries (left Y-Axis) and the number of days (right Y-Axis) with that many entries.
It is somewhat intuitive that there are many days with a small number of entries a not that much days with a high number of entries. (This is reflected by the orange curve).
It is less intuitive that there is an almost equal number of entries no matter how many entries a day has. The explanation for this is simple however: The higher number of entries on busy days compensates the lower number of busy days.
We see, there are about as many trades on days with less than 16 entries as on days with more than 16 entries.
We have seen above that the former are positive while the later are negative. All trades together tend to have an average profit close to zero.
DrKoch you are so fast! I'm still trying to digest all of this. Thank you. I'll be out until late today, but I will review all of your findings in detail.
@eugene I'd suggest to change the discussion title to something like:
Limit Order Strategies and Position Size and Granular Processing: Why is OneNight so good (in EOD backtests only)
Limit Order Strategies and Position Size and Granular Processing: Why is OneNight so good (in EOD backtests only)
Since we are prioritizing positions which open at or below the limit price, we should see that these positions are much more profitable than those randomly selected during post market open times.
DrKoch's chart show a spike in position count at market open which supports the selection process. However, markets often move on open making it difficult to determine what a "normal" spike might look like.
I'll pull all positions taken in the "NSF" scenario and identify those that were taken on symbols that opened at or below the limit price. These positions should have an average profit per bar much higher than the NSF overall average.
Here's what I found:


Positions taken at market open have return ~0.33% profit per position.
Positions taken not at open (random throughout the day) return ~0.045% profit per position.
Positions taken at market open have over 7x better results than positions taken throughout the day.
The difference is staggering. And it does explain why OneNight will perform much better in the NSF scenario. Fewer taken positions means that a larger percent of positions will be taken at market open and profit % will increase significantly.
Now to figure out how to take advantage of this knowledge...
QUOTE:
Positions taken at market open have over 7x better results
This is an interesting result. And as shown in Plot#2 of Post #12 this holds even for days with many entries.
As Plot#3 of Post #12 suggests, there are many entries at market open.
Taken together there follows an interesting suggestion: Replace the Limit Entry Order in the OneNight strategy by an Limit on Open (LOO) order.
This should reduce the number of positions somewhat (in a no-NSF scenario, small positions) but should improve performance (average profit per trade) quite a bit.
And furthermore: With LOO orders the difference between NSF and no-NSF scenario should become much smaller.
(I have no WL at hand in this moment, so all these are predictions based on the former analysis)
And it sparks another idea: To leverage the effect of "busy days" we need some forecast of "busy-ness" i.e. how many orders will be filled during the day?
With LOO orders it is possible (albeit not quite simple in a backtest) to count the number of fills at Market Open and use this number as a proxy for the expected fills during the day.
I'd predict: If such a rule is added to the OneNight Strategy it will improve its performance substantially.
We are thinking alike. I'll be working on these strategy variants. I'm still blown away by the contrast between positions taken on market open vs all others. So interesting.
QUOTE:
If a trade opens below the limit it will get filled at a higher priority than another one with a higher weight. That might be why you’re seeing unexpected results?
I've been trying to validate this logic using the OneNight strategy, and I'm running into an issue I can't explain. Here's what I did.
Unlimited Daily
Backtest in an unlimited position scenario (no NSF positions). Daily bars are used without granular backtesting enabled.
Unlimited Daily with 1M Granual
Backtest in an unlimited position size scenario. Daily bars are used and granular backtesting with 1-minute bars is enabled.
The results are as expected. These 2 scenarios return the exact same positions and performance metrics. Since there are no NSF positions, this does not yet validate the priority being placed on symbols that open at or below the limit price.

Limited Daily
Backtest in a limited position size scenario such that WL needs to select which positions to take. Granular backtesting is not enabled.
Limited Daily with 1M Granular
Backtest in a limited position size scenario such that WL needs to select which positions to take. Granular backtesting is enabled using 1-minute bars.
The limited daily scenario does not always select symbols that were at or below the limit price at open. Limited Daily with 1M granular scenario does always select qualifying positions chronologically which prioritizes those that open at or below the limit price.

I selected a random date to demonstrate this. There are many other days in the back test that show the same behavior.
It seems that something else is going on here. In many cases, the Limited Positions Daily backtest does prioritize positions that open at or below the limit price, but not always. I can't find a pattern that explain this. The limited position size allows for 5 trades per day and each position has sufficient size to take any single position. The same position sizing using the Limited position Daily bar with granular backtest select positions chronological as expected.
Please let me know if I can provide more details to help isolate this.
Since you didn't specify it, for now let's just assume Wealth-Data is the highest priority Historical provider. W-D Daily opening prices (the primary market center opening price) will frequently not match intraday opening prices.
See recent examples of differences at https://www.wealth-data.com
So, let's discard that possibility first by ensuring that Wealth-Data is not used as your Daily provider (uncheck it), and use any other Daily provider, like Q-Data.
See recent examples of differences at https://www.wealth-data.com
So, let's discard that possibility first by ensuring that Wealth-Data is not used as your Daily provider (uncheck it), and use any other Daily provider, like Q-Data.
Take AVY on 9/18 for example.
W-D open: 220.56
Any other daily provider open: 219.00
What does it mean?
MOO orders would have been filled at 220.56, but the first full-lot trade occurred at 219.00. Limit orders would not have participated in the opening auction, so the lesson is: don't use Wealth-Data for that test.

W-D open: 220.56
Any other daily provider open: 219.00
What does it mean?
MOO orders would have been filled at 220.56, but the first full-lot trade occurred at 219.00. Limit orders would not have participated in the opening auction, so the lesson is: don't use Wealth-Data for that test.
Sorry, I should have specified the dataset. I'm using IQFeed for both daily & intraday.
The positions that were not take in the Limited Daily scenario were taken in the unlimited daily & unlimited daily granular scenarios, and limited daily granular backtest scenarios.
Now I'm more confused. When I look at IQFeed's daily & minute bars, neither one seems to indicate that a trade should have been taken. I need to back track to verify that I was using IQFeed throughout these tests.


I see what is going on now. Not all 9:31 positions are taken at open. Some are taken during the 1 minute between 9:30 and 9:31.
The positions taken at open should match those selected when doing the Limited Daily backtest. I'll verify a few. Since we have a timestamp of 9:31 representing the first bar, is there any way to know which positions were taken on open specifically?
The positions that were not take in the Limited Daily scenario were taken in the unlimited daily & unlimited daily granular scenarios, and limited daily granular backtest scenarios.
Now I'm more confused. When I look at IQFeed's daily & minute bars, neither one seems to indicate that a trade should have been taken. I need to back track to verify that I was using IQFeed throughout these tests.
I see what is going on now. Not all 9:31 positions are taken at open. Some are taken during the 1 minute between 9:30 and 9:31.
The positions taken at open should match those selected when doing the Limited Daily backtest. I'll verify a few. Since we have a timestamp of 9:31 representing the first bar, is there any way to know which positions were taken on open specifically?
Unfortunately, much of my prior analysis is flawed. I need to regroup on this. Here's the conundrum.
Strategy = OneNight
Scale = Daily
Position size = 20% of equity (there will be NSF positions)
Granular Limit/Stop = Disabled
Logic = Limit by at 2% below prior close. Sell at market after 1 bar.
In this situation, WL is appropriately performing the backrests by prioritizing symbols that open at or below the limit price. The results of this backtest is quite good.
When performing the same test with position sizing that does not result in NSF positions, performance it poor.
When performing the same test with granular limit/stop processing, the results are poor.
When replicating the logic on a 1-minute bar, performance is poor. This is not an apples-to-apples comparison as there is no way to buy at open when you are backtesting on a 1-minute bar unless you want to leave an order open overnight which would be the same as running the strategy on daily bars.
Hypothesis
OneNight performs well when position sizing is such that NSF positions will be present because positions that open at or below the limit price are prioritized and outperform all positions take after market open. The nuance I missed previously is that the 9:31 bar includes both positions taken at open and positions taken during the first minute of the session.
Open Question
How can this be implemented? I'm monitoring 500 symbols (IQFeed streaming limit). If any of them open 2% below the prior close, I want to buy using a limit order. If the limit order is not filled at market open, I want to cancel it. I don't think this exist but what I need is essentially a Buy Limit on Open Order.
The best idea I can come up with is to use the Quote/Trigger window. Set the threshold very high; 99. But then I would need to manually quickly cancel all orders that do not fill immediately on market open.
Thoughts?
Canceling all open orders is easy >> the Cancel All button does that.
If all the symbols opened and traded at the same time (any liquid symbol on Nasdaq will trade at 09:30:00), that method would work. The problem is that with NYSE staggered openings in the mix, it won't work for those. You may have to wait as many as 5 minutes (rarely more) for all of those to open.
It's kind of funny but what you need is the opposite of OrderType.LimitMove. A LimitMove order will not be Auto-placed if the open is beyond the limit price. That order type was created for WL based on entering undesirable trades based on news events, like earnings reports.
You need a custom solution, or simply accept any order that hit for the first few minutes.
Thank you again.
@Cone
I'd like to spend a day reviewing the challenges I'm facing and outline a proper solution before I attempt to build this out. Is this something that the "Day with Glitch" offering could help with?
@Cone
I'd like to spend a day reviewing the challenges I'm facing and outline a proper solution before I attempt to build this out. Is this something that the "Day with Glitch" offering could help with?
If you're talking about getting the Quotes tool to do the opposite of a LimitMove and trigger only if the open is at or equal to the limit price, then that would take a feature request and a lot of interest by the community to make it happen.
There's also the Concierge Service for custom programming jobs and consulting, but given the constraints, I personally don't see a solution for this one without adding a new "!LimitMove" feature.
There's also the Concierge Service for custom programming jobs and consulting, but given the constraints, I personally don't see a solution for this one without adding a new "!LimitMove" feature.
Got it. The challenge is even more involved. To fully implement OneNight we orders would need to be placed throughout the day by randomly selecting qualified positions.
Let me give it some more thought. Perhaps a tick based strategy could get this done.
Let me give it some more thought. Perhaps a tick based strategy could get this done.
QUOTE:
To fully implement OneNight ... orders would need to be placed throughout the day by randomly selecting qualified positions.
I think this is the wrong way to go. It looks like you try to get OneNight's (bloated) performance by simulating the EOD-Backtester's faults in realtime.
I'd suggest to recognize the original performance as a "bug" in EOD backtesting.
Instead I'd try to understand where the good trades are for OneNight and where the bad trades come form. (see Post #12 above).
I think there are plenty of ideas and possibilities to filter these trades in a "forward" manner i.e. without dirty tricks and complex daytrading rules.
Some hints:
* Avoid busy days, try to forecast volatility and stop all trading if volatility jumps up.
* Restrict strategy #1 to LOO orders.
* Two Minutes after the Open (i.e. 9:32am) run strategy#2, which checks the number of LOO fills. If this number is low, run the rest of OneNight (place Limit Orders)
Understood. Let me pull my notes together. I'll post what I know currently related to where the good trades are located.
Rather than flood this discussion, I'm going to maintain the linked document. So far, I've just captured the history. I'll add to it as I learn more.
https://leapfrogbi-my.sharepoint.com/:w:/p/paul/EZa5keEB0eJFlHcy4fQXlGUBXaSnP_uciEz5vL81vcZGLw?e=eEfXwq
---
Document updated. Added section demonstrating performance advantage of market open positions.
The data I'm reviewing suggests that the selection process for post market open positions is not random. Following is the process I'm using to validate.
1. Run OneNight with position sizing such that no NSF positions will exist.

2. Export all positions. This is the population.
3. Run OneNight with limited positions. 999,999,999 capital & 4% of equity.

4. Export all positions. This is the sample.
5. Export all symbol daily bars history for dataset used in the backtest. I'm using IQFeed S&P 500.
6. Identify symbols that opened 2% below prior close using exported symbols.
7. Segment position taken at open vs post market open; population & sample.
8. Calculate the average profit percent for all positions in both lists.

The population post market open average profit is 0.0802%. The sample's post market open profit is 0.2534%.

The margin of error is extremely small due to the relatively large sample size. Running the sample repeatedly yields the same results.
Are there other factors? Either my logic has an error or something other than random selection must be occurring.
1. Run OneNight with position sizing such that no NSF positions will exist.
2. Export all positions. This is the population.
3. Run OneNight with limited positions. 999,999,999 capital & 4% of equity.
4. Export all positions. This is the sample.
5. Export all symbol daily bars history for dataset used in the backtest. I'm using IQFeed S&P 500.
6. Identify symbols that opened 2% below prior close using exported symbols.
7. Segment position taken at open vs post market open; population & sample.
8. Calculate the average profit percent for all positions in both lists.
The population post market open average profit is 0.0802%. The sample's post market open profit is 0.2534%.
The margin of error is extremely small due to the relatively large sample size. Running the sample repeatedly yields the same results.
Are there other factors? Either my logic has an error or something other than random selection must be occurring.
QUOTE:
I'm using IQFeed S&P 500.
Your analysis has Survivorship Bias. The test should use the Wealth-Data S&P 500 to avoid that.
Also, Wealth-Data's opening price is the Market Center open - that's a true open (auction open) instead of a random small trade on some exchange where no one could possibly be filled with a limit order.
QUOTE:
Your analysis has Survivorship Bias.
I think this is not important here. As long as all tests are run on the same date the analysis is valid. We talk about differences from random trade selection and NSF positions.
QUOTE:
Either my logic has an error
I miss the "Calculated Sample" results, i.e. when you do random sampling of trades outside WL.
I guess it will be very similar to "WL Sample", let's see...
---
The text mentioned in a post above says:
Problem 1 - Buy Limit on Open: No such order exists.
Not quite true.
Interactive Brokers supports LOO orders, see here:
https://www.interactivebrokers.com/en/trading/orders/loo.php
If you want WL to support this Order Type vote for this #FeatureRequest:
Limit On Open orders)
The next build of the finantic.Eval extension will contain a set of new building blocks, called FxBlocks. These will support LOO Orders:

The FxBuy block will produce this C# code:
This will work for backtests only, of course. For LOO orders in WL-Trading vote for the #FeatureRequest Limit On Open orders (https://www.wealth-lab.com/Discussion/Limit-On-Open-orders-9099)
The FxBuy block will produce this C# code:
CODE:
double limitPrice = bars.Close[idx]*0.98;
if(idx < bars.Count -1 && bars.Close[idx+1] <= limitPrice) // simulate LOO
{
  _transaction = PlaceTrade(bars, TransactionType.Buy, OrderType.Market, 0.0, 0,
                              "Buy Limit on Open (LOO): Close * 0.98");
}
This will work for backtests only, of course. For LOO orders in WL-Trading vote for the #FeatureRequest Limit On Open orders (https://www.wealth-lab.com/Discussion/Limit-On-Open-orders-9099)
Thank you for the feedback.
Yes, the dataset I'm using does have survivorship bias. However, this is true both in the population & the sample (NSF) scenario. It should not impact the results of random selection.
I did not create a Calculate Sample. I can do so, but the law of large numbers dictates that the sample average will closely resemble the population average if the sample is of sufficient size. This is the core issue. Currently the NSF scenario is sampling, but the results are not near the population average.
-----
IB LOO - Very interesting. I didn't know this type of order actually exist. I'm not using IB, but depending on where this analysis leads, that might need to change.
-----
Here are a few randomly generated Post Market Open Avg Profit Per Position results. I'm using a 20% sample size; similar to the above NSF scenario. The results are as expected; near the population mean. Sometimes a little lower, and sometimes a little higher. Never 3x higher.
QUOTE:
The law of...
Does not apply here.
We sample on busy days only. The " normal days" are taken comletely.
Thus sampling reduces trades of busy days selectively.
Are you sure your simulation works that way?
No, I didn't take the busy day (more positions than buying power) into consideration. I don't think it will make much difference, but I can set up a calculation that will do this. In order for this to work correctly, I have to first calculate how many positions were taken on open. Then, subtract this from the number of positions possible with the given positions size of 4% of equity (25 total positions per day).
I'll work that out and report back.
I'll work that out and report back.
Well, yet again my intuition was wrong. When I calculate the random selection while considering how many positions are taken post open, the results closely match WL generated outputs.
Back to the drawing board. I'm reviewing the recommendations and trying to understand exactly what this means.

Back to the drawing board. I'm reviewing the recommendations and trying to understand exactly what this means.
The below chart shows average daily profit pct (Y axis) by the number of post open positions opportunities (X axis). This suggests that lower volatility results in higher returns.

The scientist says:
Now we know a few things for sure:
1. It is not a software bug
I remember this effect being present in the old days of WL3. We had a couple of WealthScripts (nowadays called strategies) with names "Variations of a theme.. " that exploited the very same effect as OneNight does today. Finallly pfelix has shown (above) that it happens outside of WL the same way.
2. It is related to busy days
Pfelix has done the critical experiment: Sampling of trades on days with many opportunities. And this makes the difference. I'd predict: If we skip the busy days complety (in a synthtic backtest) the results of OneNight will be even better.
3. It is all related to volatility
On days and with symbols with high volatility there are many trades. And these days and symbols make the difference.
Remark: All of this is suggested by Plot#1 in Post #12 and confirmed by Post #54.
Remark#2: The effect is rather robust: It happens for many "Variations of the theme". The only thing that is required: Enter long with a Limit order. So please dont point fingers at OneNight.
So it all comes down to this one question: How is it possibe to predict volatility?
That is what has kept me up most of the night. How do we predict volatility? I have a few ideas, but nothing great. More analysis to come...
Current hypothesis;
On high volatility days, we have a lot of market open positions. This leads to less post market open positions when position sizing is limited. Since market open positions have a high profit percent, this works out well for strategy results.
On low volatility days, we have less positions taken on market open and more post market positions. Since post market open positions taken during low volatility days have a high profit percent, this works out well for the strategy results.
I'll work on proof.
I second that. Its the high volatility post market open positions that destroy the performance.
QUOTE:
I'd predict: If we skip the busy days complety (in a synthtic backtest) the results of OneNight will be even better.
Correct. If we can find a way to trade only during days where there are < 200 post market open positions opportunities, then performance would improve.

Same chart with ramdom sampling (outside of WL) added as a second data series. Just for confirmation.

Assuming we could forecast volatility and only trade on low volatility days, how would OneNight perform?
Process:
- Backtest OneNight; 10 years with 1-minute granular processing. Unlimited positions (no NSF). WL provided an entry time in the position list.
- Export all positions; add to database.
- Identify days which have over 200 position opportunities. Exclude all position for these high volatility days.
- Exclude all market open positions; requires limit open order which is not supported currently.
- Select the first 25 remaining positions ordered chronologically. Equal to 4% of equity position size scenario.
Results
- 0.14% Profit Per Position
Run the same scenario as above except select remaining positions randomly (not chronologically).
Results
- 0.28% Profit per Position
This is an unfortunate outcome. From this we can draw a conclusion.
While low volatility days do result in higher profit per position, these positions' profit percent are not randomly distributed. Generally, positions early in the day are less profitable as demonstrated in prior analysis. Taking positions chronological even after limiting trading to low volatility delivers half the return as random position selection.
Ideally, we would randomly select positions throughout the day, but this is impossible, as we do not know how many symbols will qualify until after the end of the session. Perhaps a method could be derived to apply randomness to positions taken or not taken chronologically, but this will undoubtedly lead to lower exposure and therefore lower APR.
One solution that I thought might improve results is to only take positions after a certain time of the day therefore skipping the early day less profitable positions. Unfortunately, this also does not work out; the later in the day we wait to start taking positions the less resulting exposure and any gains are offset by missed profitable positions.
I'm stuck again. Any thoughts?
Would good days be defined as choppy? Wounding if adding a filter to trade those days would help?
Wait a moment...
I think we have (at least) four different cases here:
1. Low volatility, LOO:
Just a few tradess, high profit. Ok.
2. Low volatility, post open.
Many trades, high profit, Ok.
3. High volatility, LOO:
Medium number of trades, medium profit. Acceptable.
4. High volatility, Post Open:
Many trades, negative profits, avoid these trades.
@pfelix: could you simulation the outcome for 1+2+3 with 4 excluded?
(should be stellar)
So the task at hand:
Wait until a few minutes after market open. Try to forecast volatility of the day/number of fills for this day. If this number is too high, stop trading that day.
Does not sound too complicated to me.
@emartin197. Can you define a choppy day please? Currently we are defining a high volatility day as one with many symbols (200 or more our of the S&P 500) that reach 2% below the prior session close.
@DrKoch. Yes. I can do this analysis with item 1, 2, & 3 (exclude 4). This will bring back in the positions that are taken at market open. The issue is item 2. If I select post open positions chronologically on low volatility days, the results are not much better than the overall market. If I select them randomly, the results are good. Problem is that we can't implement random selection without knowing how many symbols will qualify.
I'll work on the 1, 2, 3 scenario and send results.
-----
Low volatility = day with 200 or less symbols out of the S&P 500 that reach 2% below prior session close
Position Size = 4% of equity (25 positions per day max)
Measure = Average Profit per Position
Market Open Positions on Low Volatility Days = 0.3930%
Market Open Positions on High Volatility Days = -0.2150%
Market Open Positions all days = 0.2324%
*** Chronological Selection ***
Post Market Open Positions on Low Volatility Days = 0.1889%
Post Market Open Positions on High Volatility Days = -0.6501%
Post Market Open Positions all days = 0.0799%
Note: This logic can be implemented. If we perfectly predict volatility, we can expect 0.1889% profit per position. Likely, we will not be able to perfectly predict volatility which means our expected profit per position will be lower.
*** Chronological Combined Selection ***
All Market Open Positions + Post Market Open Positions on Low Volatility Days selected Chronologically = 0.1669%
Market Open Positions on Low Volatility Day + Post Market Open Positions on Low Volatility Days selected Chronologically = 0.2036%
*** Random Selection ***
Post Market Open Positions on Low Volatility Days = 0.3052%
Post Market Open Positions on High Volatility Days = -0.0224%
Post Market Open Positions all days = 0.2620%
*** Random Combined Selection ***
All Market Open Positions + Post Market Open Positions on Low Volatility Days selected randomly = 0.2821%
Market Open Positions on Low Volatility Day + Post Market Open Positions on Low Volatility Days selected randomly = 0.3213%
Updated 10/5/2024 8:06pm central
- slight error in formula (immaterial).
- added random selection sections
Updated 10/6/2024 6:48am central
- To identify market open symbols, using bar detail instead of 9:31 timestamp.
- No material changes; updated all profit rates slightly.
Choppy would be defined in my terms to be listless, a narrower range than normal, or put slightly different - not materially trending up or down.
Let me see if I can find a way to identify choppy @emartin197.
There is a choppiness indicator in the indicators... The ones I have used in the past use R-squared, maybe add it to a block based strategy, look at the C# code to see how it works.
Or worst case put it on @ES or SPY and chart it to see how it compares to "bad" or "good" days...
Or worst case put it on @ES or SPY and chart it to see how it compares to "bad" or "good" days...
I'm playing around with Block based strategies today. Here's one way to implement OneNight using a block strategy.

I checked a few positions and it does seem to operate the same as the c# stategy. The only trick is getting the close price of the current bar. I used SMA with 1 as the bars to average.
The generated code is clean as well. Good job WL team!

Even better; don't use SMA of 1 period. Just use the "Close" indicator.

I checked a few positions and it does seem to operate the same as the c# stategy. The only trick is getting the close price of the current bar. I used SMA with 1 as the bars to average.
The generated code is clean as well. Good job WL team!
Even better; don't use SMA of 1 period. Just use the "Close" indicator.
You can just use Close instead of SMA.
QUOTE:
So it all comes down to this one question: How is it possible to predict volatility?
Before we try to predict volatility it is certainly useful to find good ways to measure volatility.
Some discussion about volatility measurements can be found in the discussion thread
Volatility Indicators for Breakout Strategies (https://www.wealth-lab.com/Discussion/Volatility-Indicators-for-Breakout-Strategies-9463)
Thanks. I'll read up.
What do you think about the rates above? Based on what I'm seeing currently, even if we are great at predicting volatility, we may not see very high profit per position.
What do you think about the rates above? Based on what I'm seeing currently, even if we are great at predicting volatility, we may not see very high profit per position.
Recap of what we learned so far. Generalizations to follow.
High Volatility Days = Losing trades. This includes both trades taken on open and those taken post open.
Low Volatility Days = Winning trades. This includes both trades taken on open and those taken post open.
Volatility - based on number of symbols out of the S&P 500 that reach 2% below prior to day close. Low volatility is defined as 200 or less symbols (40% or less).
NSF - Not all possible positions will be taken due to insufficient funds.
Random - Post market open positions provide a high return (better than SPY) only when taken randomly which is not possible in real trading situations.
Chronological selection, while profitable, cuts the random selection profit nearly in half and is only worth trading on low volatility days. Even assuming we can perfectly predict volatility, the return is not great.
Where does this leave us?
I see no compelling reason to trade post market signals. We can't implement random selection and perfect volatility predictions leads to not great returns.
Market open signals are highly profitable on low volatility days. There are not enough of these opportunities though. If we can overcome the challenges associated with limit open orders which are not supported by all brokers, we would still end up with a low APR due to low exposure.
As much as I hate to say it, I think it may be time to move on to the next strategy.
Your Response
Post
Edit Post
Login is required