Using b88. The issue appeared a few builds ago.
Issue: The Strategy Monitor (SM) shows a different size each day for Open positions in strategies using the Percent Volatility (PV) position sizer.
---------------------
Say I have a daily strategy that trades volatile stocks. For risk control, position sizing is set with the PV sizer using both stock's volatility and account equity, as follows:
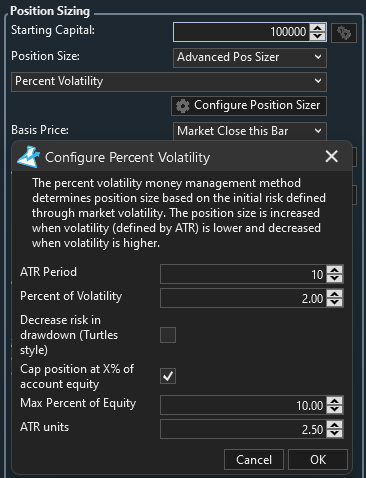
- volatility-based sizing uses ATR
- this is further capped at xx% of equity
Each day I run the strategy in SM after downloading data it gives a different size for open positions e.g. if the initial signal was to buy 950 shares @some limit price and that order is filled, each subsequent daily run in SM shows a different size for that open position e.g. one day it may show 910 shares, the next day 917 shares, etc.
I'll point out that basis price is 'Market Close this Bar' so its not like the next bar's Open caused a different size than the original signal (besides, it wouldn't cause daily size fluctuations).
My best guess is that for calculating the position size the sizer is using the last bar's ATR or equity value, or both, instead of using their values on the signal bar (on which the original position size was based). As these values likely fluctuate from day to day this is causing the sizer to recalculate the "original" size ( = size of Open position) thus causing the fluctuations.
PV-based sizing used to be stable in the past but these size fluctuations started occurring after some recent update. Note: The issue is only with the trade size, not with trade price as the profit and stop prices are stable.
P.S. Strategies that use fixed $$ sizing give stable sizes.
Issue: The Strategy Monitor (SM) shows a different size each day for Open positions in strategies using the Percent Volatility (PV) position sizer.
---------------------
Say I have a daily strategy that trades volatile stocks. For risk control, position sizing is set with the PV sizer using both stock's volatility and account equity, as follows:
- volatility-based sizing uses ATR
- this is further capped at xx% of equity
Each day I run the strategy in SM after downloading data it gives a different size for open positions e.g. if the initial signal was to buy 950 shares @some limit price and that order is filled, each subsequent daily run in SM shows a different size for that open position e.g. one day it may show 910 shares, the next day 917 shares, etc.
I'll point out that basis price is 'Market Close this Bar' so its not like the next bar's Open caused a different size than the original signal (besides, it wouldn't cause daily size fluctuations).
My best guess is that for calculating the position size the sizer is using the last bar's ATR or equity value, or both, instead of using their values on the signal bar (on which the original position size was based). As these values likely fluctuate from day to day this is causing the sizer to recalculate the "original" size ( = size of Open position) thus causing the fluctuations.
PV-based sizing used to be stable in the past but these size fluctuations started occurring after some recent update. Note: The issue is only with the trade size, not with trade price as the profit and stop prices are stable.
P.S. Strategies that use fixed $$ sizing give stable sizes.
Rename
Yes, ATR is an unstable formula thatr requires a sufficient seed period to stabilize the data. For ATR Period = 10, at least 40 bars must be loaded prior to calculating the position size.
The lookback period in the SM is 5 years.
The StartIndex in the strategy is 200.
Reminder: The fluctuating position size only appeared after a recent update, was not an issue before.
The StartIndex in the strategy is 200.
Reminder: The fluctuating position size only appeared after a recent update, was not an issue before.
If you run your strategy multiple times, does the profit change? If so, then your strategy has NSF positions, so unless you use a transaction weight the equity will not be stable from run to run.
- The profit target and stop prices do not change; the issue is with position size, not price
- There are no NSF positions
- A transaction weight is used
To repeat: Only the position size changes after each daily data update, not the price targets.
Clearly, its recalculating the size of the original trade based on "new" info (ATR and/or equity) which it shouldn't be doing.
- There are no NSF positions
- A transaction weight is used
To repeat: Only the position size changes after each daily data update, not the price targets.
Clearly, its recalculating the size of the original trade based on "new" info (ATR and/or equity) which it shouldn't be doing.
Current equity (could be backtest or broker equity) and "Starting equity" are inputs to the equation. Starting Equity is the initialized to the Current equity when the first position is sized. Depending on when you start the backtest, that can change and will change the risk profile for all positions that are sized after that.
Try using a fixed start date rather than variable (recent 5 years) to avoid this.
I’ll also run some step by step scenarios tomorrow to see if i can replicate the issue.
I’ll also run some step by step scenarios tomorrow to see if i can replicate the issue.
I understand the Equity will change over time but it will impact all positions equally whereas ATR jumps around, esp for really volatile stocks which were the ones showing the most florid size fluctuations.
--------------------
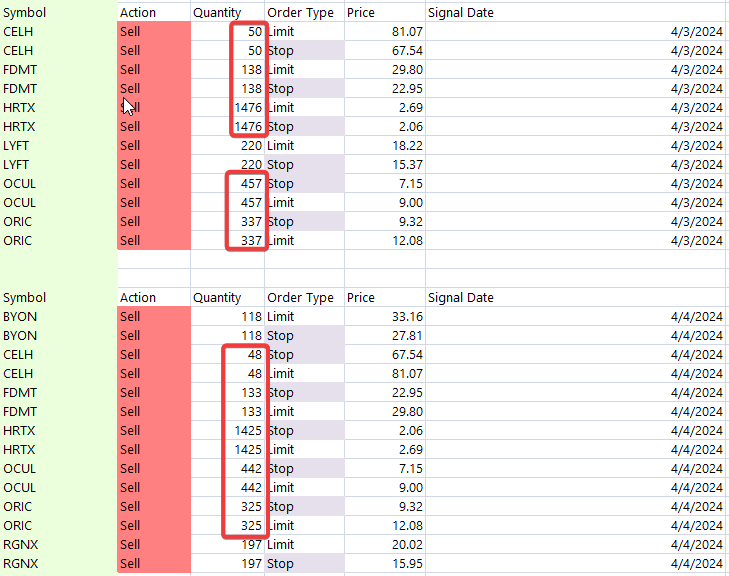
Maybe I didn't write it well. Hopefully the following graphic explains it better - this shows select signals generated by the strategy in the SM for 4/3/24 (top, based on data till 4/2/24) and for 4/4/24 (bottom, data till 4/3/24):
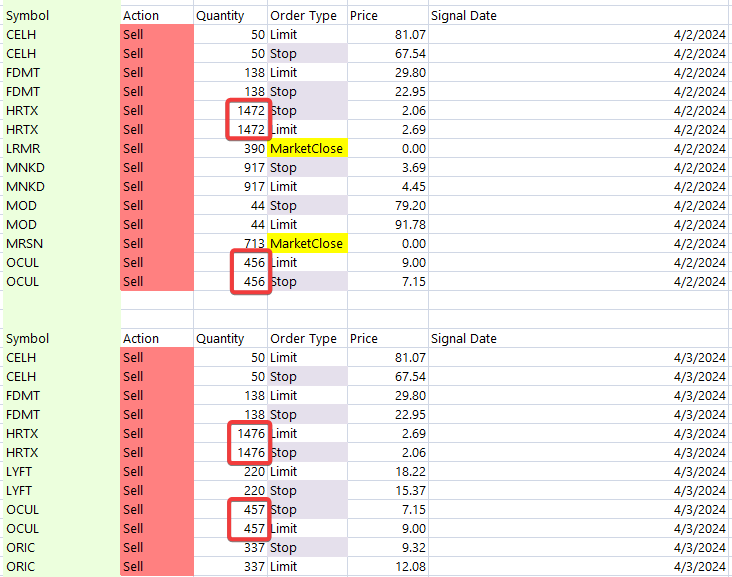
I highlighted 2 symbols whose position sizes have changed.
(The difference between the symbols in the 2 lists is b/c some positions got closed and others got opened.)
A few points I'd like to make:
- Often times the change in size is only a small % so it'll be more easily manifest when the quantity of shares is large (the bigger point is that there shouldn't be any change in position size in the first place)
- The more volatile the stock the more florid the change in position size (think: ATR is jumping around)
- I have seen upwards of 5% difference in position sizes recently; unfortunately, the examples shown above are pretty tame by comparison - but they do illustrate the issue
- Note that the Limit and Stop prices do not change even if the position size fluctuates
Lastly, this fluctuation in size of open positions only started occurring after a recent update, wasn't present before.
--------------------
Maybe I didn't write it well. Hopefully the following graphic explains it better - this shows select signals generated by the strategy in the SM for 4/3/24 (top, based on data till 4/2/24) and for 4/4/24 (bottom, data till 4/3/24):
I highlighted 2 symbols whose position sizes have changed.
(The difference between the symbols in the 2 lists is b/c some positions got closed and others got opened.)
A few points I'd like to make:
- Often times the change in size is only a small % so it'll be more easily manifest when the quantity of shares is large (the bigger point is that there shouldn't be any change in position size in the first place)
- The more volatile the stock the more florid the change in position size (think: ATR is jumping around)
- I have seen upwards of 5% difference in position sizes recently; unfortunately, the examples shown above are pretty tame by comparison - but they do illustrate the issue
- Note that the Limit and Stop prices do not change even if the position size fluctuates
Lastly, this fluctuation in size of open positions only started occurring after a recent update, wasn't present before.
I’ll set up that step by step test today as I investigate. But I’ll repeat, under the setup you described I’d EXPECT the position sizes to change. You’re using a constantly changing start date so a trade that kicked off the beginning of the backtest on one day might drop out the next day, causing a change at the start of the equity curve that ripples through the backtest.
I understand/expect that but the change in Equity would impact all open positions equally.
What I've noticed is that its the most volatile subset of stocks that show the disparate fluctuating position sizes, often of a few % magnitude, which would point the finger at ATR as the likely source i.e. a different bar's (e.g. last bar) value is being used each day instead of the signal bar's value.
What I've noticed is that its the most volatile subset of stocks that show the disparate fluctuating position sizes, often of a few % magnitude, which would point the finger at ATR as the likely source i.e. a different bar's (e.g. last bar) value is being used each day instead of the signal bar's value.
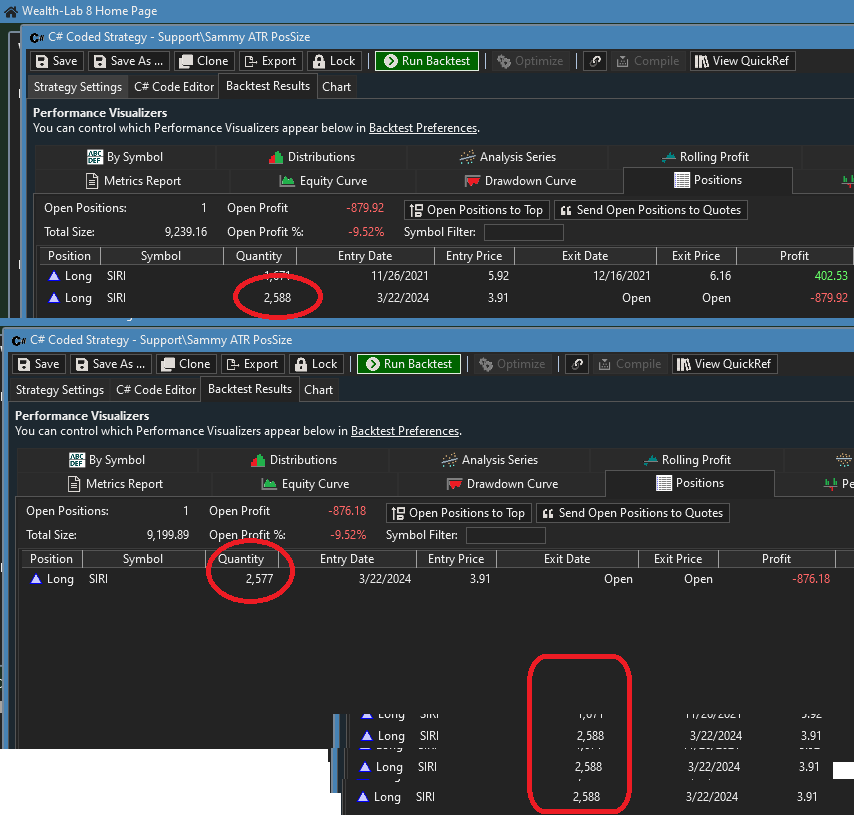
I set up a test Strategy using the position sizing settings you indicated above. I ran it on SIRI, using two tests. First was most recent 3 years. Second was most recent 1 year.
The Strategy buys one position in 2021 and one in 2024.
On the first run (recent 3 years) the size of the 2024 position was 2588. The second run (recent 1 year) the position size was 2577. This is because the first trade dropped off so the equity changed by the time the 2024 trade came around.
Next, I ran a series of tests using fixed date ranges, to simulate running it day by day. This is to test your theory that the ATR is somehow using the wrong value.
First test is 1/1/2011 to 3/23/2024 - position size is 2588.
1/1/2011 to 3/25/2024 - position size is 2588.
1/11/2011 to 3/26/2024 - position size is 2588.
... ran all tests in between, same results.
1/1/2011 to 4/4/2024 - position size is 2588.
I wasn't able to demonstrate the ATR effect you described in this test. Can you please provide the simplest possible strategy/settings to demonstrate the effect?
CODE:

using WealthLab.Backtest;
using System;
using WealthLab.Core;
using WealthLab.Data;
using WealthLab.Indicators;
using System.Collections.Generic;

namespace WealthScript1
{
    public class MyStrategy : UserStrategyBase
    {
        //create indicators and other objects here, this is executed prior to the main trading loop
        public override void Initialize(BarHistory bars)
        {
        }

        //execute the strategy rules here, this is executed once for each bar in the backtest history
        public override void Execute(BarHistory bars, int idx)
        {
         DateTime dt = new DateTime(2021, 11, 24);
         if (bars.DateTimes[idx] == dt)
            PlaceTrade(bars, TransactionType.Buy, OrderType.Market);
         dt = new DateTime(2021, 12, 15);
         if (bars.DateTimes[idx] == dt)
            PlaceTrade(bars, TransactionType.Sell, OrderType.Market);
         dt = new DateTime(2024, 3, 21);
         if (bars.DateTimes[idx] == dt)
            PlaceTrade(bars, TransactionType.Buy, OrderType.Market);
        }

        //declare private variables below

    }
}
The Strategy buys one position in 2021 and one in 2024.
On the first run (recent 3 years) the size of the 2024 position was 2588. The second run (recent 1 year) the position size was 2577. This is because the first trade dropped off so the equity changed by the time the 2024 trade came around.
Next, I ran a series of tests using fixed date ranges, to simulate running it day by day. This is to test your theory that the ATR is somehow using the wrong value.
First test is 1/1/2011 to 3/23/2024 - position size is 2588.
1/1/2011 to 3/25/2024 - position size is 2588.
1/11/2011 to 3/26/2024 - position size is 2588.
... ran all tests in between, same results.
1/1/2011 to 4/4/2024 - position size is 2588.
I wasn't able to demonstrate the ATR effect you described in this test. Can you please provide the simplest possible strategy/settings to demonstrate the effect?
One other thing to consider, you're running this in the Strategy Monitor. Is it on a single symbol or a DataSet? If you're running on a DataSet, it's possible the SM is running in multiple batches, and each batch would have its own equity. Disable this in the configuration dialog for that SM strategy.
Thanks for testing.
The issue is in the SM. Using a dataset.
How does one do that?
The issue is in the SM. Using a dataset.
QUOTE:
...each batch would have its own equity. Disable this in the configuration dialog for that SM strategy...
How does one do that?
This setting
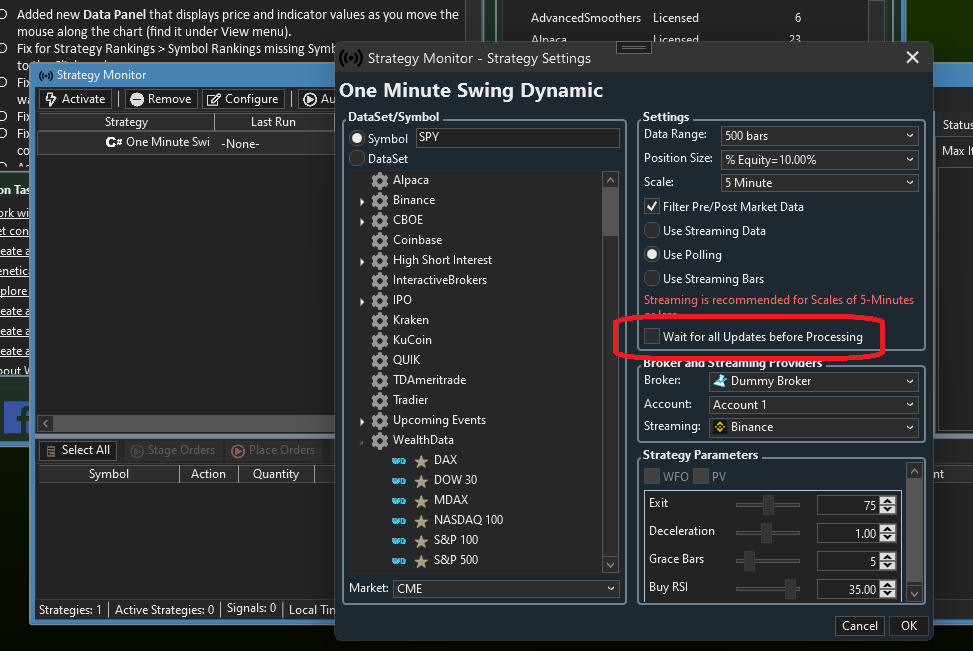
It's already UN-checked.
Side note: When I ran the strategy using fixed date ranges in order to get past signals not a single one was generated. Tried several date ranges, including as recent as 2 days ago (seen in graphic above)... not a single signal though I know for a fact that all of them had signals. Is there another setting somewhere that I need to fix so SM can generate past signals?
Side note: When I ran the strategy using fixed date ranges in order to get past signals not a single one was generated. Tried several date ranges, including as recent as 2 days ago (seen in graphic above)... not a single signal though I know for a fact that all of them had signals. Is there another setting somewhere that I need to fix so SM can generate past signals?
It should be checked to cause the strategy to avoid running in batches. As for the other questions it’s impossible to answer without having a copy of the strategy to spend further time scrutinizing. I’d suspect that some signals weren’t placed due some change in equity because of the changed start date.
Ok, I'll check the box though its probably irrelevant for me as I download data (from a 3rd party) before I run any strategy in the SM. Besides, the box appears to be for i/day data and this strategy uses Daily bars.
Still can't understand why using data ranges with recent end-dates in SM doesn't generate signals.
I'll keep an eye out for more examples of significantly fluctuating sizes of open positions.
Still can't understand why using data ranges with recent end-dates in SM doesn't generate signals.
I'll keep an eye out for more examples of significantly fluctuating sizes of open positions.
Instead of "500 bars" you can keep your ATR (and other IIR-type indicators like RSI, etc.) precisely the same for the same dates by fixing the Starting Date - use a date range like "1/2/2022 to 1/2/2030". This would remove all doubt about that possibility, albeit minor.
Update -
Sorry, I thought Gltich's image was yours. Maybe you're already doing this.
Update -
Sorry, I thought Gltich's image was yours. Maybe you're already doing this.
QUOTE:No, it's not possible to generate past signals using the S. Monitor. You can do that using the Strategy Window.
Is there another setting somewhere that I need to fix so SM can generate past signals?
If SM can't generate signals for a past date perhaps the option to set a different end date should be removed as its illusory (and wastes user's time).
Runs are always scheduled in the future, so it's already somewhat obvious, but we can add some more verbage in the User Guide if you think it's useful.
It already states this:
The Strategy Monitor alerts with the current trading signals for each activated Strategy.
It already states this:
The Strategy Monitor alerts with the current trading signals for each activated Strategy.
For 'Activated' strategies, of course.
But seems like that is also true for 'Run Now' option.
Instead of adding verbage to the User Guide (which few people read) might be better to just gray out the option to choose a last date as it doesn't work.
Of course, the best situation would be for SM to use the user-specified Date Range - including the last date even if its different than last bar's date - in the Run Now mode so one can generate historical signals should the need arise.
Run Now activates the strategy to run it.
If Glitch feels the need to grey-out the End Date, seems like a good suggestion.
If Glitch feels the need to grey-out the End Date, seems like a good suggestion.
Updated graphic:
Strategy signals generated in the SM for 4/4/24 (top, based on data till 4/3/24) and for 4/5/24 (bottom, data till 4/4/24):
The size of all open positions (circled) has declined by about 3.5-4%. When I ran a portfolio backtest the account equity had only declined about 0.5% from previous bar. ATR values were relatively stable (for open positions).
Perplexing.
Did you change to a fixed date range?
To me, that simply looks like your account lost some money yesterday. These sizes are based on the account equity, and since "the market" was down a good bit yesterday, there's a good chance that any account long stock was down too.
If that's the case, why wouldn't you expect these signal sizes to change from day to day?
Based on your settings above (and ignoring the 10% cap and rounding), sizes are calculated like this - and equity is big part of it.
If that's the case, why wouldn't you expect these signal sizes to change from day to day?
Based on your settings above (and ignoring the 10% cap and rounding), sizes are calculated like this - and equity is big part of it.
CODE:
double vola = _atr[idx] * 2.5;
size = (equity * 2.00 / 100d) / vola;
These are sell signals, so the fact that that the sizes of the open positions are changing day to day leads me to believe Sammy is using a "Recent Years" or similar date range.
Ok, thanks! I'll just show myself out the door then! :)
I'm using recent 5 years in SM, as I'd mentioned in Post #2.
------------------------------
I hate to waste the developers' time any more on this but I think this situation can be quickly resolved if they can please check:
For calculating the size of open positions is the Percent Volatility sizer using [PositionEntryBar -1] (i.e. the signal bar) which is the correct usage
- OR -
Is it using [idx] (i.e. the current bar) which would be incorrect
The developers (me) in Post #10 already answered this in detail.
It's using the correct index.
Please use a FIXED start date to avoid changing equity.
It's using the correct index.
Please use a FIXED start date to avoid changing equity.
Thanks for clarifying.
Using a fixed start date won't really solve the issue of changing equity (but see below for a suggestion) e.g. if I set a start date it follows the end date would also have to set [and only the (data's) last date will work] AND it will have to be updated every day to keep it current, which is rather impractical.
Suggestion
Using Equity % for position Sizing requires the user to input a value for Starting Capital and hope that over the lookback period in SM it will evolve to a value that you would currently use; its basically trial and error. If, instead, one can set a Fixed Value for Equity one would currently use it would vastly simplify things and avoid day-to-day fluctuations. A box can be created just below the Starting Capital box, labeled something like 'Use this for Equity Value (overrides Starting Capital)', etc. It can be adjusted periodically to keep it around where one would like it to be.
It'll be a big boon to those who use, or are thinking of using, Equity % for position sizing. Hope you'll consider it.
Developers might come up with what is correct (in your exquisite opinion) - like calculating the size of open positions based on an arbitrary date (e.g. PositionEntryBar-1, Flash Crash bar, Chinese New Year bar etc.) or adding a 1000th input field under (or over) the Starting Capital box - but only in a concierge support job.
Just use a FIXED DATE RANGE such as 1/1/2019 to 1/1/2124. That will be good for the next 100 years.
Using the fixed date range you suggested would imply a forever-lengthening actual lookback period and would likely get the Equity more and more out of line with the actual value the user wants to use "currently". Like most users I allocate only a fraction of total equity to a strategy (and that amount is "Equity" for position sizing purposes). As I develop or retire strategies this fraction/value would likely change, alongwith total a/c Equity, so if there was a box one could easily input the value one wants to use "currently".
Interesting idea, you can submit this as a #FeatureRequest in a new topic?
Ok, may be a few days before I get to write it up.
Hope it comes to fruition.
Ciao.
Hope it comes to fruition.
Ciao.
Your Response
Post
Edit Post
Login is required