Cone:
Sorry, I destroyed your post accidentally, but the answers are below
Eugene:
Restored from a web cache!
---
Hi Guys,
A few questions regarding creating volume profiles.
1) I was trying to create a Volume Profile for a specified range.
Specifically, I have a zig zag that I want to create a profile for each change of trend (i.e. higher highs, lower lows). Because zig zags lag I need to create a profile for a range that doesn't include the recent bars.
The volume profile constructor doesn't seem to allow for that:
VolumeProfile(BarHistory bars, int lookback, int barCount, double valueRange = 70.0, int? idx = null)
Is there another way around this?
2) I couldn't find a method After creating the volume profile how do I plot the profile on the chart? Do you have an example?
3) I want to bring in lower time frame data to produce the volume profiles (i.e. say use 1 minute data to produce the profiles and plot that on a daily chart). How would I approach that?
Rename

- ago
#1
QUOTE:Read the QuickRef for the instructions, especially the part about the optional idx parameter (shown in your own post).
Is there another way around this?
2. Afaik, you can only show the Volume Profile with the drawing toolbar. You can also plot the VolPro* indicators, but I think what you're suggesting is to plot a new profile for each ZZ segment, right?
3. Use BarHistorySychronizer. But I'd question, "what advantage is there to compressing bars to get the volume profile?"
Thanks Cone.
1. Yes, thank you. Blame laziness on that question. I stopped reading half way through the constructor description (sorry).
2. Yes, I would like to draw the profile. I assume there must be a method used to render the profile object.
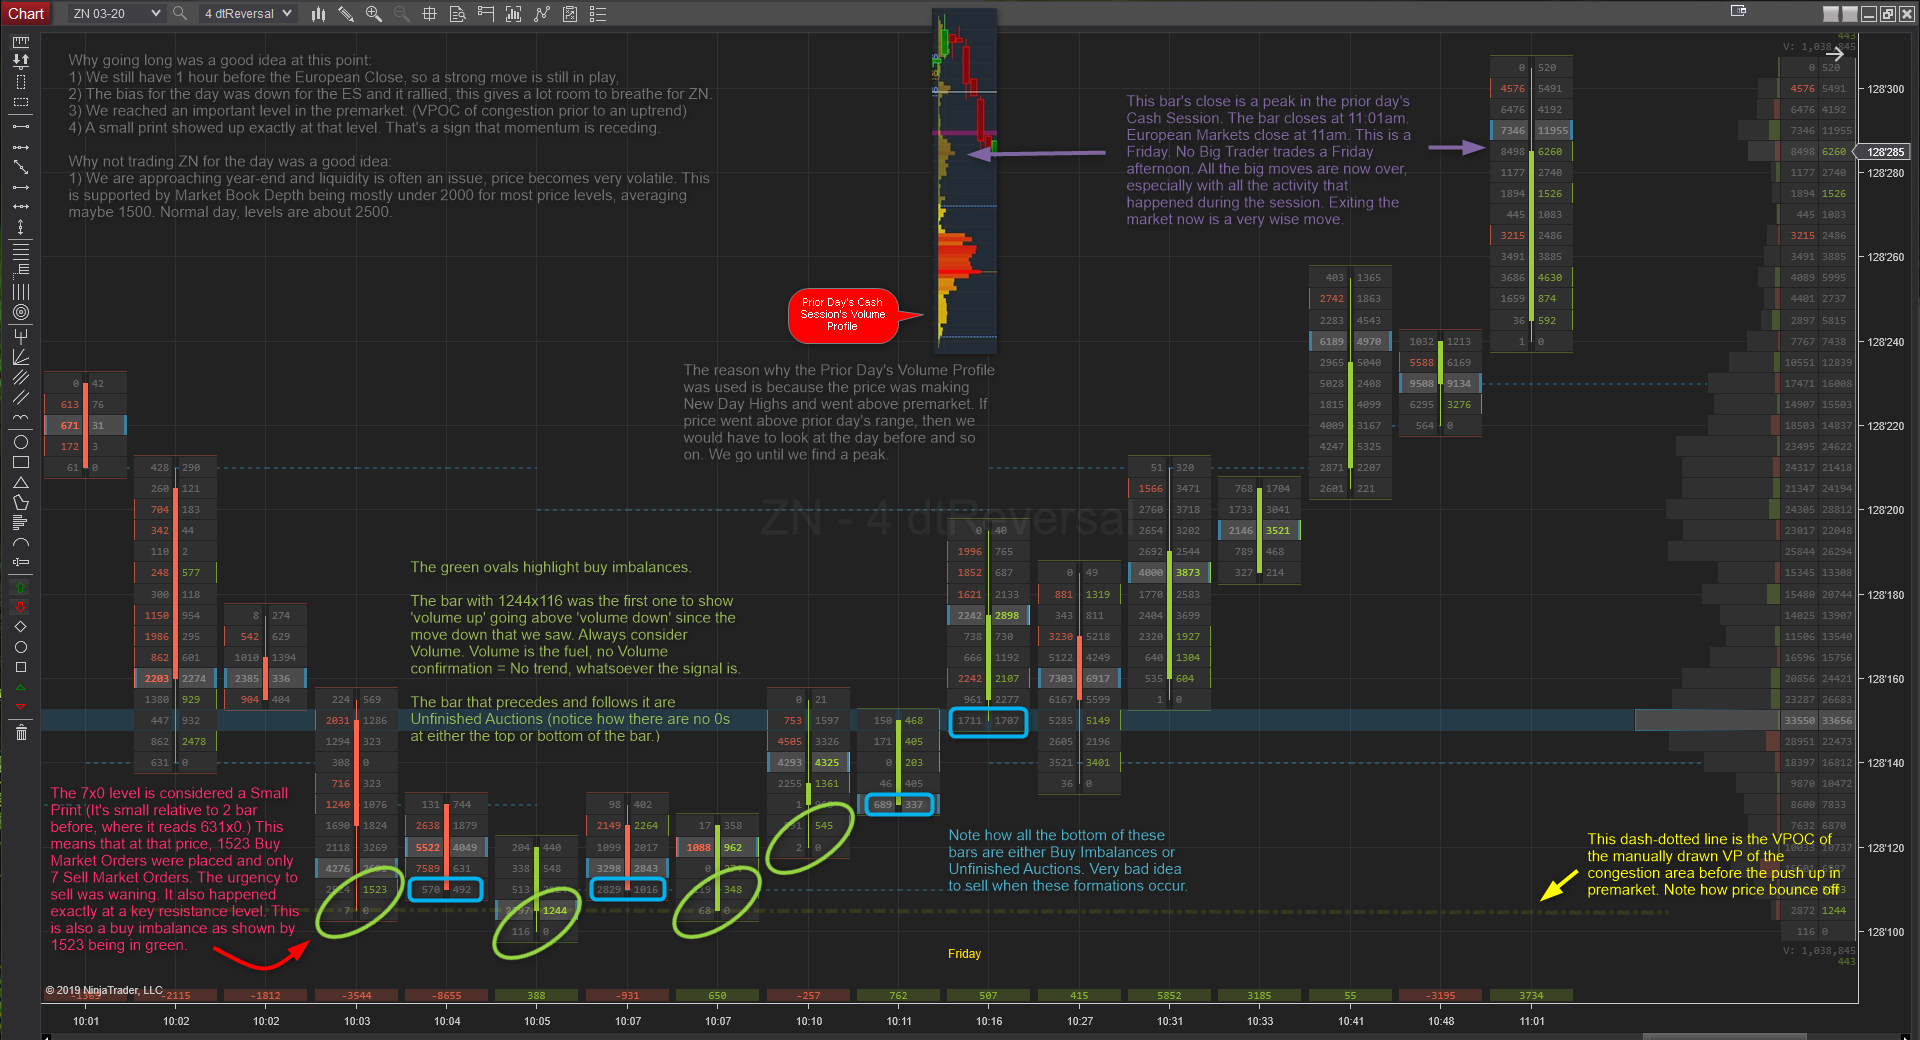
3. It is common the use higher time frame bars with lower time frame data when using volume profiles. It lets you see more information and identify imbalances. Here is an example. (If you are interested I can send links to other sites that explain in detail).
1. Yes, thank you. Blame laziness on that question. I stopped reading half way through the constructor description (sorry).
2. Yes, I would like to draw the profile. I assume there must be a method used to render the profile object.
3. It is common the use higher time frame bars with lower time frame data when using volume profiles. It lets you see more information and identify imbalances. Here is an example. (If you are interested I can send links to other sites that explain in detail).
- ago
#3
Uggh, all those random numbers make my head spin.
Anyway, you can create these discrete Volume Profiles at any bar you wish, but you'll have to draw them in the chart yourself. In the QuickRef. Select Class: VolumeProfile and then click on the Items property for an example.
QUOTE:Sure there is, but not in the context of a strategy (see below...)
I assume there must be a method used to render the profile object.
QUOTE:Maybe, but it's counter-intuitive considering how a Volume Profile is calculated. More granular has to be more accurate, right? (I'm not a VP expert.)
It is common the use higher time frame bars with lower time frame data when using volume profiles. It lets you see more information
Anyway, you can create these discrete Volume Profiles at any bar you wish, but you'll have to draw them in the chart yourself. In the QuickRef. Select Class: VolumeProfile and then click on the Items property for an example.
Thanks Cone.
What is the method to render a VP in the context of an indicator? I can then create a custom VP indicator and then reference it in a strategy.
What is the method to render a VP in the context of an indicator? I can then create a custom VP indicator and then reference it in a strategy.
Here are the ways I could think of accomplishing it, with some pros and cons:
Render in a Strategy
Pro: fairly straightforward since the strategy has access to all of the relevant data, and can use the built in "DrawRectangle" etc methods to render the VPs. Unfortunately we don't have an out of the box way to render a VP in a strategy, but that could be a feature request.
Con: It might bog down the strategy processing because so many objects would need to be rendered.
Render using a Custom Plot Style
This is your indicator idea, it would be achieved by creating a custom Indicator Plot Style Extension, and then maybe using that Plot Style for a ZigZag indicator that you drop onto the chart.
Pro: Faster rendering
Con: Complexity, having to build an Extension outside WL, and having to remember to assign the Plot Style to the Indicator
Custom Chart Style
It could be achieved by creating a custom Chart Style Extension, maybe derived from CandleChartStyle or BarChartStyle. The additional rendering code could render the VP's that are created in the Chart Style Initialize method.
Pro: I think it's the best packaged solution, it's all in once place and you just need to select that new Chart Style in the chart.
Con: Complexity, having to build an Extension outside WL
We are considering offering some custom development services on an hourly contract basis, so building out one of these extensions might be a good first candidate for this service.
- ago
#6
See the VolPro* indicators - but these are not "piecewise" indicators, i.e., they have a continuous lookback like a moving average does.
If want to create piecewise Volume Profiles (one for each zig zag) then see the example that I referenced. You have to program it to calculate and plot at the end of each zig zag.
If want to create piecewise Volume Profiles (one for each zig zag) then see the example that I referenced. You have to program it to calculate and plot at the end of each zig zag.
Thank you guys. That was very helpful. When you have the details on the custom development services please let me know.
Hey mjj3, we have our Concierge Support page up now, take a look:
https://www.wealth-lab.com/Support/Concierge
https://www.wealth-lab.com/Support/Concierge
Thank you. I will write up some specifications this weekend.
Best
Mitch
Best
Mitch
Your Response
Post
Edit Post
Login is required