Hello everyone,
I’m new here and I’m trying to figure out how to rank stocks on a specific date within a stock universe (e.g., Nasdaq 100) using the Relative Strength Levy (RSL) since 15+ years. For example, in the first step, I receive a buy signal based on the closing prices from the Nasdqa 100 Index itself on February 3, 2017. In the next step, I’d like to rank the stocks in the Nasdaq 100 (wich are included at exactly this time) based on their RSL—comparing the average price over, say, the last 26 weeks—from highest to lowest. How can I do this analysis? Regards, Jannis
I’m new here and I’m trying to figure out how to rank stocks on a specific date within a stock universe (e.g., Nasdaq 100) using the Relative Strength Levy (RSL) since 15+ years. For example, in the first step, I receive a buy signal based on the closing prices from the Nasdqa 100 Index itself on February 3, 2017. In the next step, I’d like to rank the stocks in the Nasdaq 100 (wich are included at exactly this time) based on their RSL—comparing the average price over, say, the last 26 weeks—from highest to lowest. How can I do this analysis? Regards, Jannis
Rename
In Blocks, see Conditions > Symbol Ranking by Indicator.
If you code yourself, do it in the Blocks, then "Open as a C# Coded Strategy" to see how it was done.
If you code yourself, do it in the Blocks, then "Open as a C# Coded Strategy" to see how it was done.
Wealth-Lab is not ranking software but backtesting software. The individual indicator values are not displayed in the results for each strategy; to my knowledge, this is not possible.
If you want to use the RSL for 26 weeks, you first need to change the settings to "week" (alternatively, 130 days).
Since Wealth-Lab is designed so that each backtest only begins when the indicator reaches the specified number of days, you must start the dataset (date range) from February 3, 2017, to the 130th day before February 3, 2017.
Since you want to buy specific assets, you specify how many positions you want to buy. With a 20% of E (Equivalent Value), it makes sense to buy the 5 highest or lowest values.
New Block Strategy, select "buy at market," choose the transaction weight, select the RSL indicator, set it to 130, and you're done.
``` Since they haven't mentioned an exit strategy, I can only guess. If they don't build an exit strategy, then no exit strategy will be implemented. Just to test it, try "Sell after N Bars"—that should at least produce some kind of result.
The Nasdaq 100 you're referring to is the N100 from Wealth.Lab (BIOS adjusted).
Good night.
Suppose for the first step you want to buy when QQQ is above its 200 SMA, this is how you do that and rank individual stocks with their RSL.
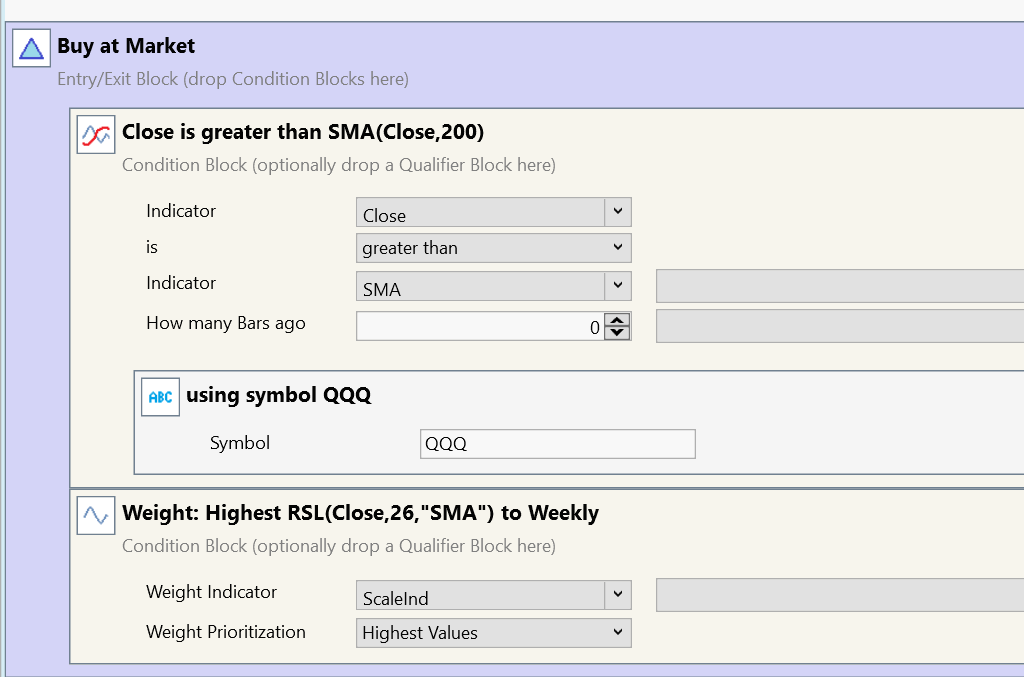
The second Condition uses the ScaleInd indicator to get the moving average in a weekly scale
Your Response
Post
Edit Post
Login is required