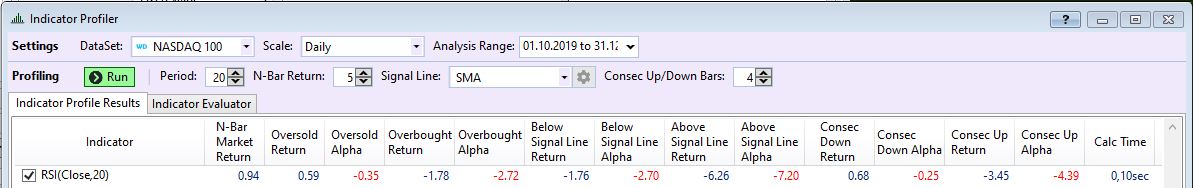
When I tried to get a better insight into the Indicator Profiler I ran a simple example based on the RSI, dataset is Nasdaq 100, time frame Oct 1st 2019 to Dec 31st 2019. The result is al follows:
Going to the Indicator Evaluator I get
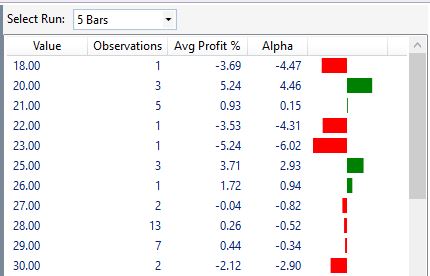
with 39 observations below or equal 30 as standard oversold level, resulting in an average profit of 0.587 (calculated in EXCEL) that matches the result in the indicator profiler of 0.59.
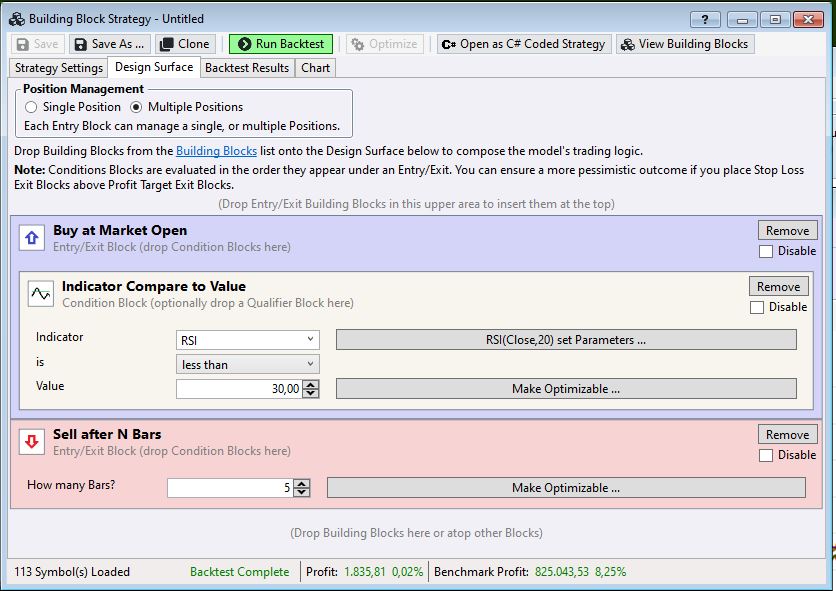
I tried to rebuild the same strategy with building blocs.
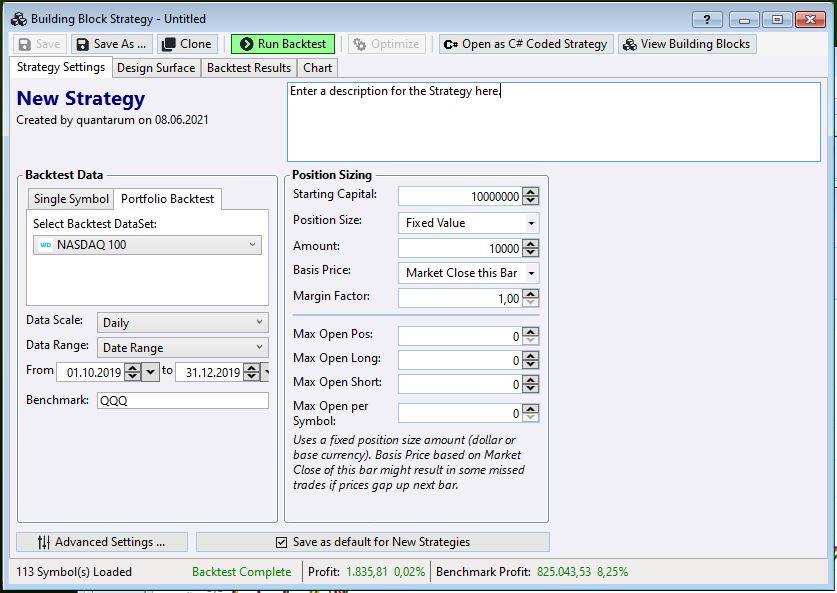
As result I get as Metrics Report
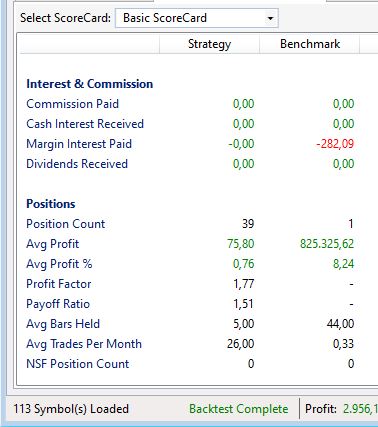
The number of observations equals position count, but the Avg Profit % in Building Blocs is 0.76 instead of 0.59 in the indicator profiler.
How can I get rid of the deviations? Are there special settings I have to change?
Going to the Indicator Evaluator I get
with 39 observations below or equal 30 as standard oversold level, resulting in an average profit of 0.587 (calculated in EXCEL) that matches the result in the indicator profiler of 0.59.
I tried to rebuild the same strategy with building blocs.
As result I get as Metrics Report
The number of observations equals position count, but the Avg Profit % in Building Blocs is 0.76 instead of 0.59 in the indicator profiler.
How can I get rid of the deviations? Are there special settings I have to change?
Rename
Try selling after 4 bars, this would result in an exit at the next bar’s open and might be in line with the figure that the IP calculated. Not at a computer now so I can’t verify.
Selling after 4 bars gives a different result, but is still not matching the indicator profiler data.
By the way: RSI(20) less than 30 and RSI(29) less than or equal 30 give the same result.
By the way: RSI(20) less than 30 and RSI(29) less than or equal 30 give the same result.
Isn't the block strategy missing the "Consec Up/Down Bars: 4" condition specified in the profiler.
According to the help text I assume that "Consec Up/Down Bars: 4" is not part of the basic strategy but the evaluation shows what is happening if the enty signal is that the indicator moved 4 consecutive days up resp. down, quite similar to use the crossing of the indicator with its SMA as signal line.
As far as I know the Indicator Profiler does not allow to combine several indicators.
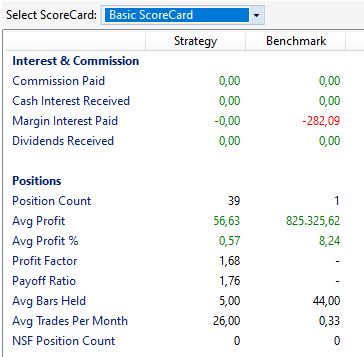
Including "ConsecDown (Close) greater than or equal 4" in the basic strategy yields a significantly reduced number of observations (as is to be expected) and the following result:
As far as I know the Indicator Profiler does not allow to combine several indicators.
Including "ConsecDown (Close) greater than or equal 4" in the basic strategy yields a significantly reduced number of observations (as is to be expected) and the following result:
My mistake. Consec Down/Up is a different set of measures.
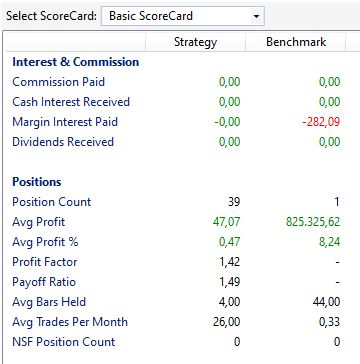
The return is Close to Close. Change the rule to sell at MarketClose after 4 bars so that it exits on the close of the 5th bar. Since there's no block rule for MarketClose, you'll need to "Open as C# Coded Strategy" and change the exit's OrderType from OrderType.Market to OrderType.MarketClose.
The return is Close to Close. Change the rule to sell at MarketClose after 4 bars so that it exits on the close of the 5th bar. Since there's no block rule for MarketClose, you'll need to "Open as C# Coded Strategy" and change the exit's OrderType from OrderType.Market to OrderType.MarketClose.
With your adaptions we are getting much closer. Now we have an Avg Profit Pct in the backtest of 0.57 instread of 0.59 in the indicator profiler.
But when I analyze the Positions in detail the number of observations per parameter value fits, but the Avg Profit Pct forf the individual parameter value still differ.
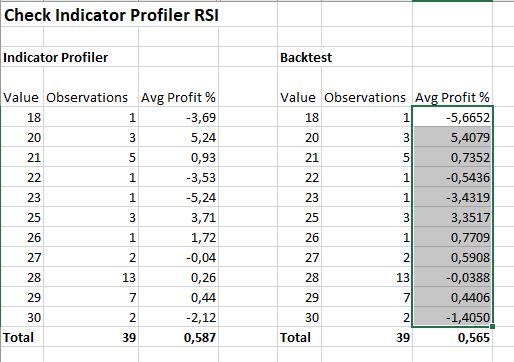
Seems that there is still an adaption to be made.
But when I analyze the Positions in detail the number of observations per parameter value fits, but the Avg Profit Pct forf the individual parameter value still differ.
Seems that there is still an adaption to be made.
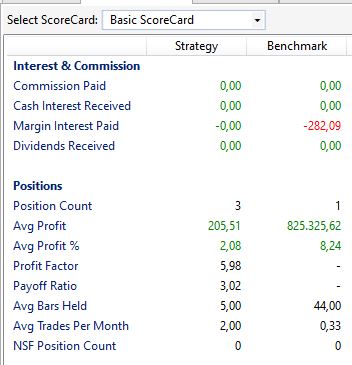
Here is how to match them exactly. The IP profit is currently calculated as the closing price at bar+N minus the opening price of bar+1. The idea is, the signal is given at bar N, and you can respond to it by the open of bar N+1.
Here's an example where I isolated one trade, RSI(10) is 20 or below, one observation. Evaluator was set to display the tabular results at 10 bars out.
Here's the code.
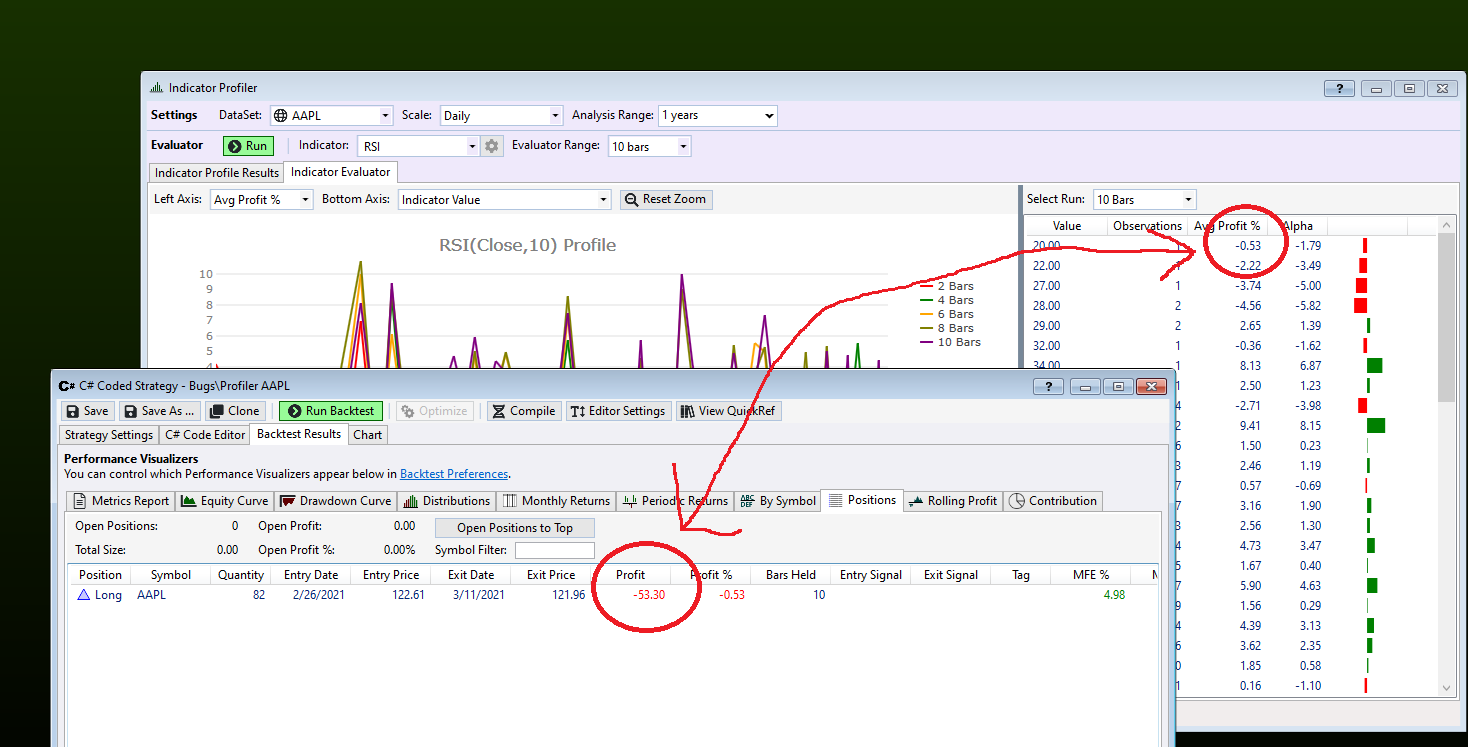
Here's an example where I isolated one trade, RSI(10) is 20 or below, one observation. Evaluator was set to display the tabular results at 10 bars out.
Here's the code.
CODE:

using WealthLab.Backtest;
using WealthLab.Core;
using WealthLab.Indicators;

namespace WealthScript1
{
    public class MyStrategy : UserStrategyBase
    {
        //Initialize
        public override void Initialize(BarHistory bars)
        {
         rsi = RSI.Series(bars.Close, 10);
        }

        //Execute
        public override void Execute(BarHistory bars, int idx)
        {
         if (idx == bars.Count - 1)
            return;
            if (OpenPositions.Count == 0)
            {
                if (rsi[idx] <= 20.0)
               PlaceTrade(bars, TransactionType.Buy, OrderType.Market);
            }
            else
            {
                if (idx - LastPosition.EntryBar >= 8)
               PlaceTrade(bars, TransactionType.Sell, OrderType.MarketClose);
            }
        }

      //private members
      private RSI rsi;
    }
}
Your Response
Post
Edit Post
Login is required