Code for this chart below.
Run as-is, or copy the DrawIntradayVolumeProfile() method to another strategy and call it from Initialize(). It works for any intraday interval, but you'll get better resolution for 5 minute or more granular intervals.
Run as-is, or copy the DrawIntradayVolumeProfile() method to another strategy and call it from Initialize(). It works for any intraday interval, but you'll get better resolution for 5 minute or more granular intervals.
CODE:Merry Christmas!
using System; using WealthLab.Backtest; using WealthLab.Core; using WealthLab.Data; using WealthLab.Indicators; using System.Collections.Generic; namespace WealthScript9 { public class VPIIntraday : UserStrategyBase { public override void Initialize(BarHistory bars) { DrawIntradayVolumeProfile(bars, WLColor.FromArgb(255, 100, 200, 255)); StartIndex = 1; } public override void Execute(BarHistory bars, int idx) { } // copy this routine and call it from Initialize public void DrawIntradayVolumeProfile(BarHistory bars, WLColor clr, int alpha = 100, int profileBars = 20, double valueRange = 70, bool vpBehindBars = true, bool showVolumePane = false) { ChartDisplaySettings cds = new(); cds.ShowVolumePane = showVolumePane; SetChartDrawingOptions(cds); VolumeProfileItem _lastPOC = null; List<IChartPoint> points = new List<IChartPoint>(); for (int idx = 1; idx < bars.Count; idx++) { if (bars.IsLastBarOfDay(idx) || idx == bars.Count - 1) { // draw level from previous day's POC if (_lastPOC is not null) { double pocLvl = (_lastPOC.RangeMax + _lastPOC.RangeMin) / 2d; DrawLine(idx, pocLvl, idx - bars.IntradayBarNumber(idx) - 1, pocLvl, WLColor.Gold, 2, behindBars: vpBehindBars); } int mbars = (bars.IntradayBarNumber(idx) + 1) * 2 / 3; // max bars for POC VolumeProfile vp = new(bars, bars.IntradayBarNumber(idx) + 1, profileBars, valueRange, idx); foreach (VolumeProfileItem vpi in vp.Items) { if (vpi.IsPOC) { _lastPOC = vpi; continue; } int x1 = idx - (int)(vpi.WidthPct * mbars); DrawVPI(x1, idx, vpi); if (vpi.IsPOC) _lastPOC = vpi; } //draw POC last if (_lastPOC is not null) DrawVPI(idx - mbars, idx, _lastPOC); } } void DrawVPI(int x1, int x2, VolumeProfileItem vpi) { points.Clear(); HistoricalDataPoint hdp = new(x2, vpi.RangeMin); points.Add(hdp); hdp = new(x2, vpi.RangeMax); points.Add(hdp); hdp = new(x1, vpi.RangeMax); points.Add(hdp); hdp = new(x1, vpi.RangeMin); points.Add(hdp); int aa = vpi.InValueArea ? alpha : alpha * 2 / 3; FillPolygon(points, clr.SetAlpha((byte)aa), behindBars: vpBehindBars); WLColor rclr = vpi.IsPOC ? WLColor.Gold : WLColor.Black; DrawRectangle(x1, vpi.RangeMin, x2, vpi.RangeMax, rclr, behindBars: vpBehindBars); } } } }
Rename
What an amazing gift, thanks! Maybe I should convert that into a drawing object? 🤔
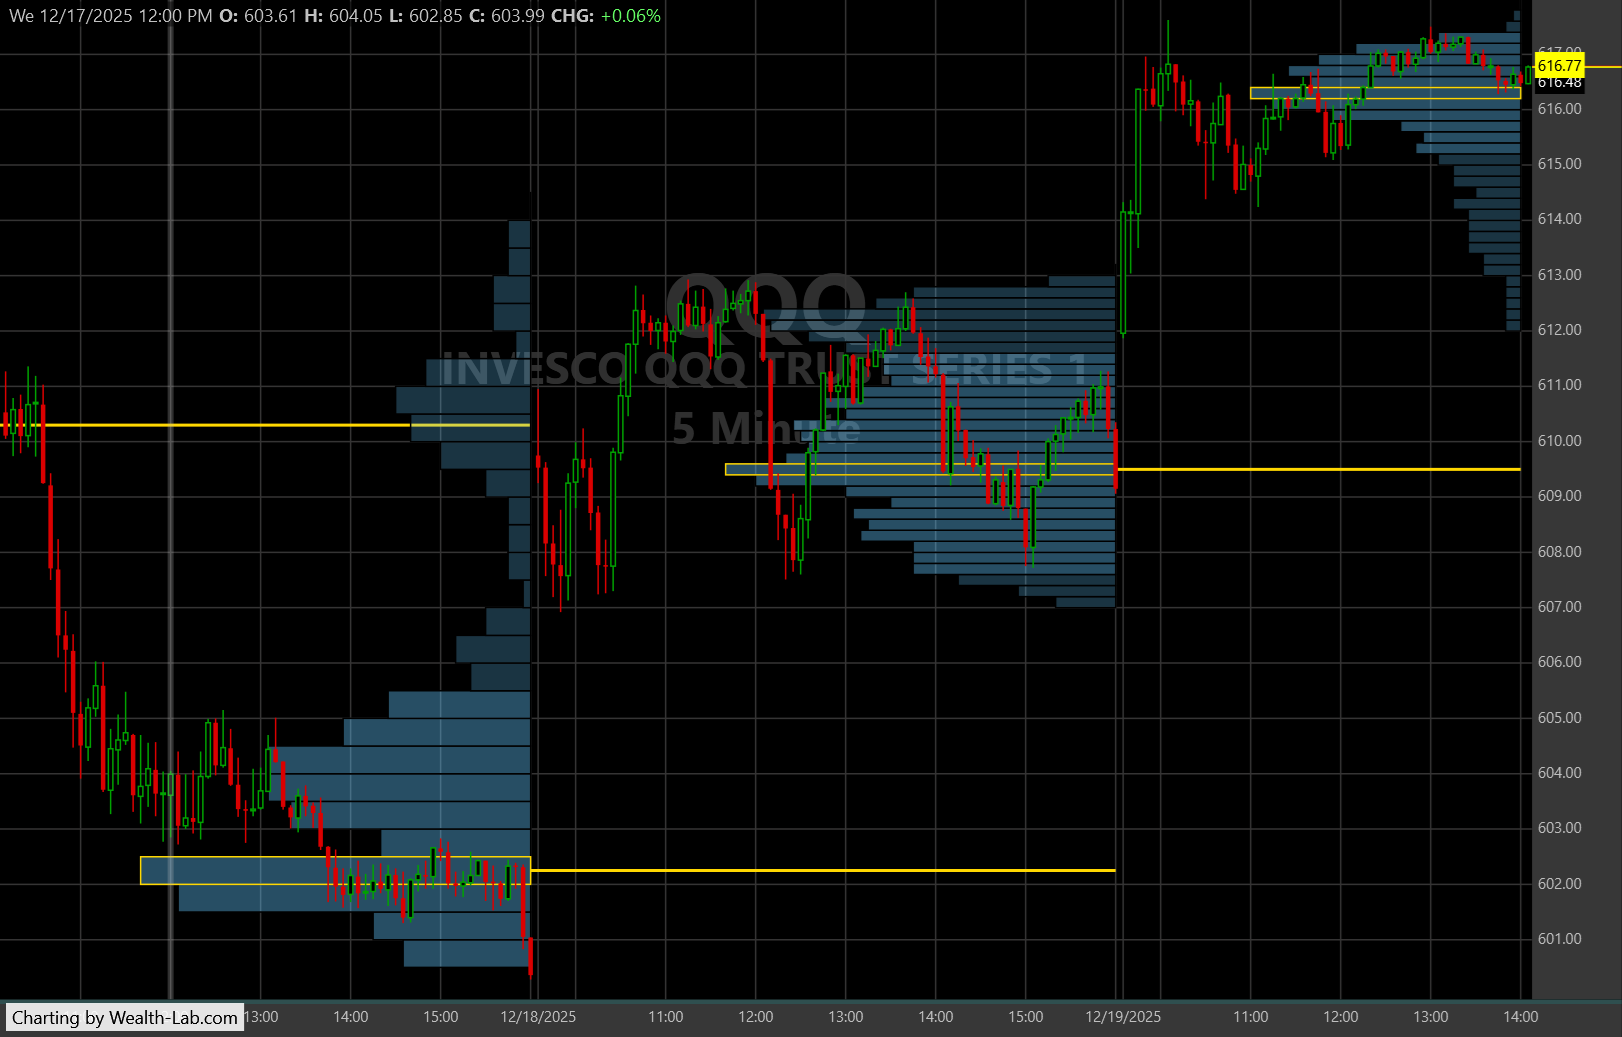
Of course this was only possible due to Glitch's Volume Profile work (https://youtu.be/qgl61z4v_8I). There's already a more detailed drawing object, but it's not dynamic for intraday charts by day and interval. In a streaming chart, this code updates the profile for the current day without adjusting the parameters (and extends the POC value to the next day).
Your Response
Post
Edit Post
Login is required