Does anyone have any experience obtaining historical Implied Volatility (IV)? What provider did you use, and what is the cost? I know it's available via Nasdaq Data Link (formerly Quandl.)
Rename
Interesting, no but I'll try that.
How is this different from CBOE -> VIX and friends?
(VIX1D, VIX3M, VIX6M, VIX9D, etc)
(VIX1D, VIX3M, VIX6M, VIX9D, etc)
The difference is i’m looking for each individual stock’s IV on a historical basis.
I asked Microsoft CoPilot:
I'd give CoPilot a try and ask it follow-up questions.
QUOTE:
What historical stock data providers offer historical implied volatility on a symbol-by-symbol basis?
QUOTE:
Here are some top-tier providers that offer historical implied volatility data on a symbol-by-symbol basis:
🧠 Leading Providers
- OptionMetrics
Offers IvyDB databases with end-of-day implied volatility, Greeks, and options prices dating back to 1996. Covers U.S., European, and Asia-Pacific markets. Ideal for institutional research and backtesting.
- IVolatility.com
Provides deep historical options and futures data, including volatility surfaces and analytics. Their APIs support symbol-level queries and are popular among retail and institutional traders.
- SpiderRock
Specializes in volatility surface datasets, including end-of-day and intraday implied volatility curves. Offers symbol-specific data with earnings event filtering and skew analysis.
- Option Strategist
Publishes free weekly implied volatility and historical volatility data for stocks, indexes, and futures. Great for retail traders needing percentile rankings and comparative analysis.
- Datarade
Aggregates datasets from multiple vendors like FinPricing, Intrinio, and Trading Volatility. You can browse and compare providers offering symbol-level implied volatility data across global markets.
If you're looking for API access, volatility surfaces, or percentile rankings, each of these providers has a slightly different strength. Want help narrowing down based on your use case or platform?
I'd give CoPilot a try and ask it follow-up questions.
I did a quick hack as a test and IB has it - and even at the intraday level back to 2006.
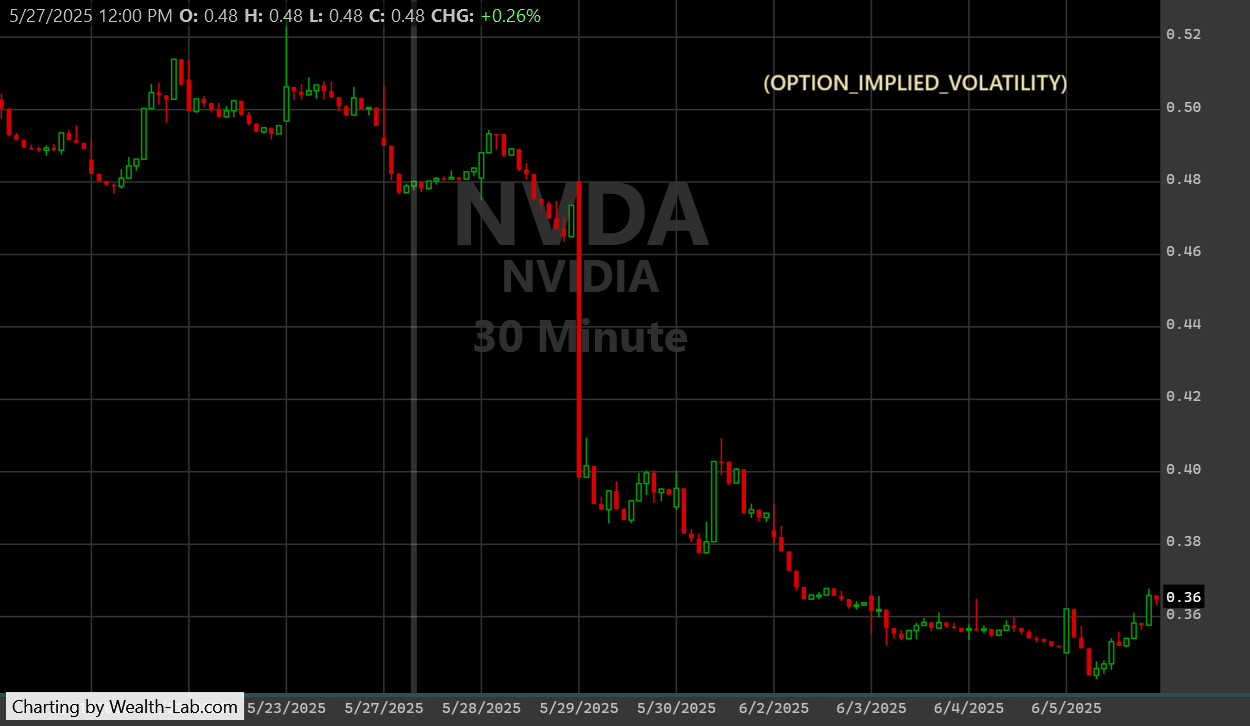
I'm not sure what Glitch has in mind, but I'd recommend using a "_IV" symbol suffix, e.g., NVDA_IV, so that the IB Provider could request the series like any other symbol. That closing series could be used as the IV TimeSeries input to OptionSynthetic.GetHistory().
With this as the IV input, synthetic option pricing should very close to real pricing - historically. (In practice IV varies a bit on OTM contracts.)
What is the symbol to use to get this for IB?
It's not a symbol. You have to alter the code to request a different data series. My suggestion was adding the "_IV" suffix to any stock, etf, or index so that the IB Provider detects it, parses out the symbol, and requests OPTION_IMPLIED_VOLATILITY instead of TRADES.
Awesome, I'll look into this!
@Cone, can you post your code for generating the IV graph? Also, does the Schwab data feed offer IV for options also? Specifically, I'm looking to plot/follow IV Rank as well. Not sure if that would need to be calculated (if there even is that data available), or if the data feed supplies that, which they have on their platform(s) but I know their API data feed does not have as much detail. But having that data could be a differentiator in choosing to buy a call vs sell a put (both bull-ish options strategies), and vice versa (sell a call or buy a put) for bear-ish expectations.
See Historical Option Implied Volality [sic] in the F1 Help, IB topic.
It seems that IB is off by a factor of 10 with IV now. Instead of a IV like 0.45 (45%) shown in the chart above, it's coming in as 0.045 (4.5%). If you're using IV for calculations, you'll need to multiply this result by 10 until IB fixes it. I created a ticket at IB this morning.
This IV trick with symbol_IV is amazing! Without actually having historical options data, you can get a proxy by calculating via Black-Scholes, and get close (or at least get a meaningful simulation). Thanks for all your work on this Cone.
As an aside, I just tested out some code, and it seems to be mostly working for me (I back-checked it against the IV reported by the IBKR app vs the charted IV in WL8), at least for NVDA, TSM, and AMZN on my brief spot check NVDA 0.35 (35.4% in app), TSM 0.38 (38.7% in app), AMZN 0.34 (34% in app). But for some reason, MU had some really screwy results (way off the charts), not sure if my data was corrupted or what, so will re-try
As an aside, I just tested out some code, and it seems to be mostly working for me (I back-checked it against the IV reported by the IBKR app vs the charted IV in WL8), at least for NVDA, TSM, and AMZN on my brief spot check NVDA 0.35 (35.4% in app), TSM 0.38 (38.7% in app), AMZN 0.34 (34% in app). But for some reason, MU had some really screwy results (way off the charts), not sure if my data was corrupted or what, so will re-try
BTW, for anyone interested, this code is by Cone. To calculate IV Rank and chart it along with historical IV.
CODE:

using System;
using WealthLab.Backtest;
using WealthLab.Core;
using WealthLab.Data;
using WealthLab.Indicators;
using System.Collections.Generic;
using WealthLab.InteractiveBrokers;
using WealthLab.Schwab;

namespace WealthScript4ConeisAwesome
{
   public class IVRank : UserStrategyBase
   {

      Parameter _period;
      BarHistory _ivBars;
      PctRank _pctRank;

      public IVRank()
      {
         _period = AddParameter("Period", ParameterType.Int32, 252, 50, 252, 2);
      }

      public override void Initialize(BarHistory bars)
      {
         _ivBars = GetHistory(bars, bars.Symbol + "_IV");
         PlotBarHistory(_ivBars, "IV");

         _pctRank = new PctRank(_ivBars.Close, _period.AsInt);
         PlotIndicator(_pctRank);

         StartIndex = _period.AsInt;
      }

      public override void Execute(BarHistory bars, int idx)
      {
      }

   }
}
@bcdxxx. I just tried it on another machine with my other IB account, and the IV was correct there. There must be an API setting that's causing that that 1/10 factor.
On the machine where this is occurring, I'm observing it in TWS tools too, like the OptionsTrader:
- I don't think IV has ever been lower than 30% for TTD in its history!
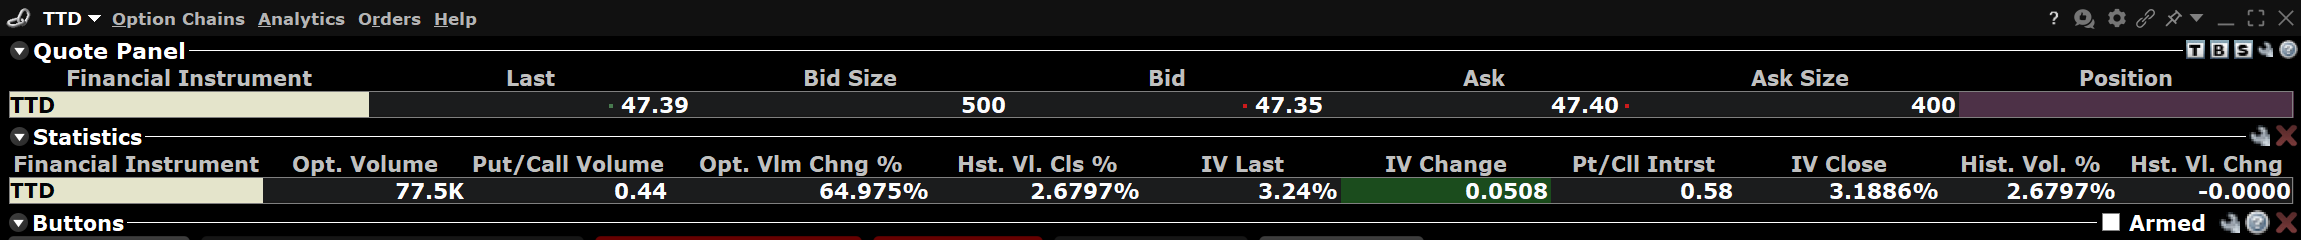
On the machine where this is occurring, I'm observing it in TWS tools too, like the OptionsTrader:
- I don't think IV has ever been lower than 30% for TTD in its history!
Found it. This should be set to Annual, not Daily.
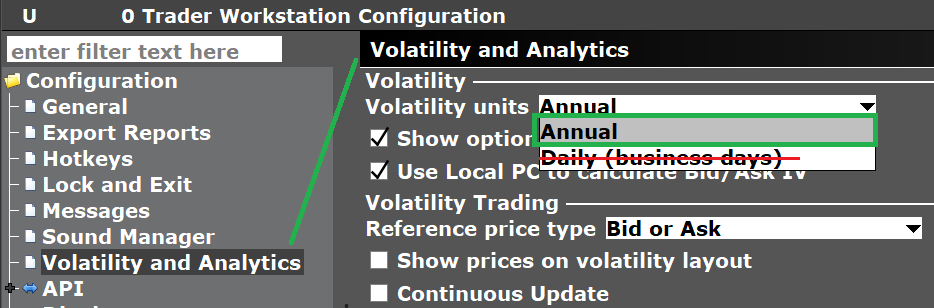
What happened is that I started logging in to a different TWS account on the machine in question and it had the "Daily" setting.
---
And I just went to delete my ticket and found the fastest reply ever from IB Support -
Those are daily volatility units. You can change to annual by right clicking on any of the IV column headers in the TWS -> show Annual
The difference between Daily and Annual Volatility:
Daily Volatility:
Measures the expected price fluctuation of an asset or option on a single trading day, usually expressed as a percentage. It reflects the standard deviation of daily returns. For example, if a stock has a daily volatility of 2%, its price is expected to move (up or down) by about 2% on a typical day, with 68% probability (assuming a normal distribution).
Annual Volatility:
Measures the expected price fluctuation over a full year, also expressed as a percentage. It’s the standard deviation of annual returns, often annualized from shorter-term data (e.g., daily or monthly returns). Annual volatility is more commonly used in options pricing models like Black-Scholes, as it provides a standardized measure over a year. For example, a stock with 30% annual volatility might move 30% up or down over a year within one standard deviation.
quick q...
Does IBKR not have _IV for all symbols?
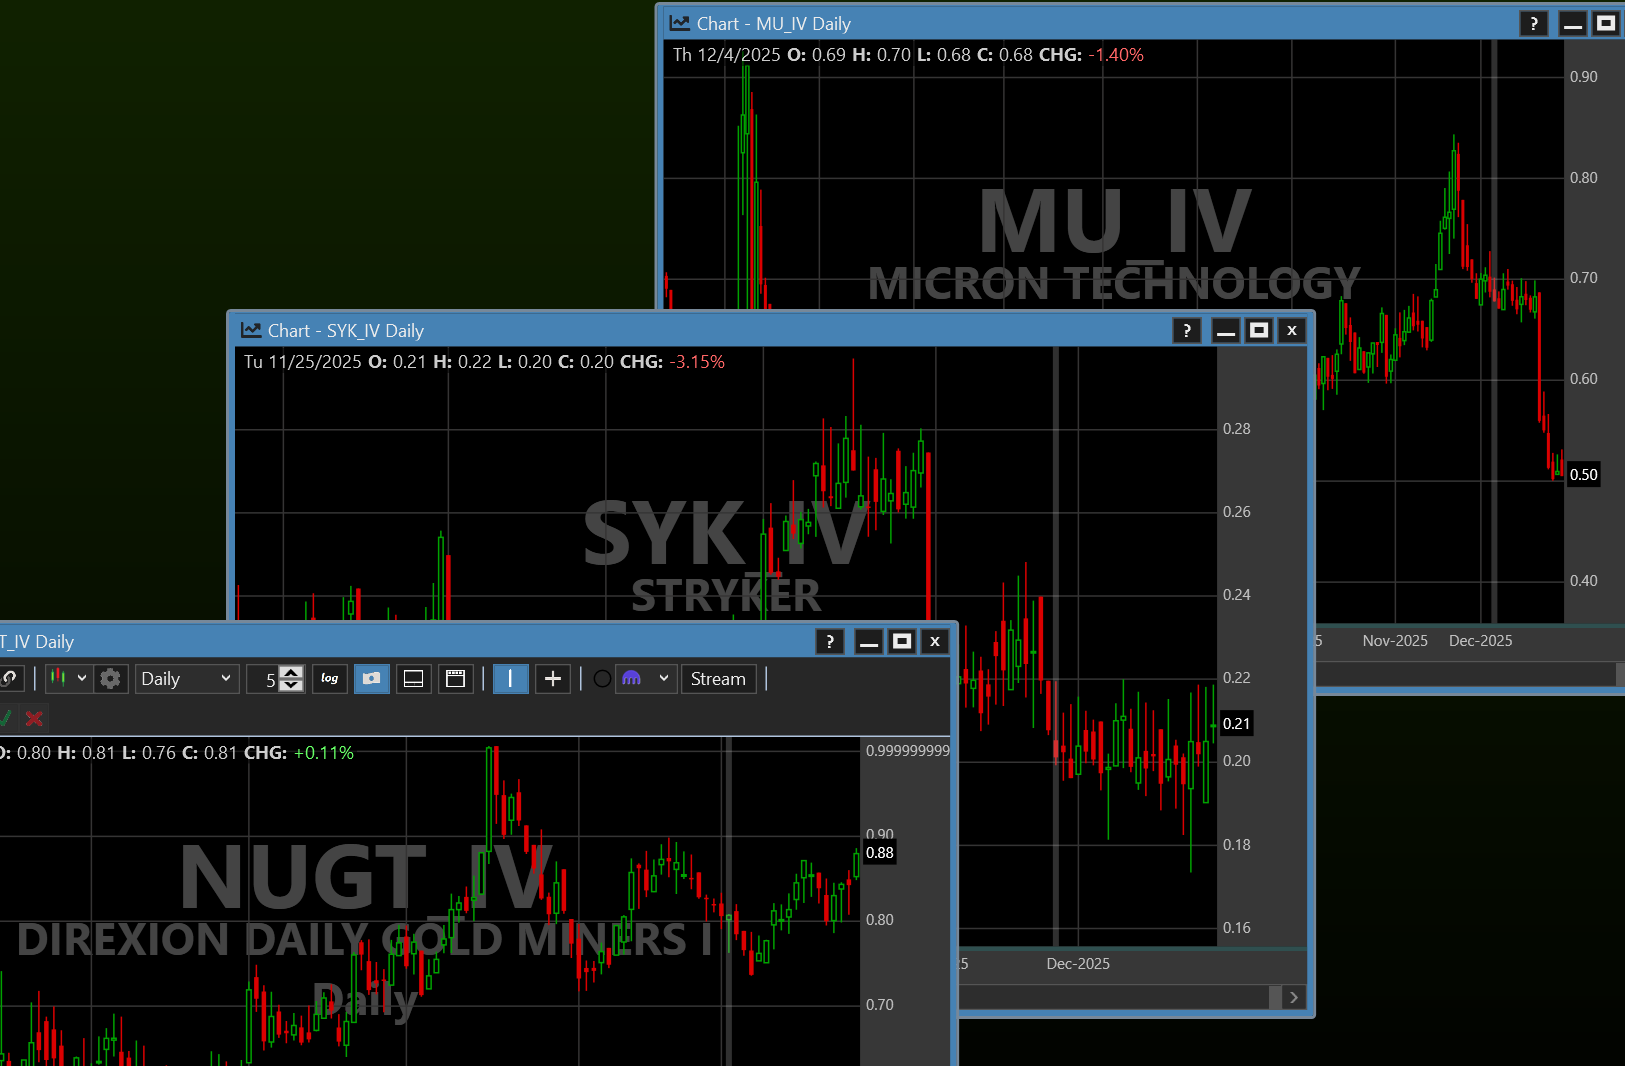
I was trying to get certain IV maps for some symbols and it fails. Specifically, I tried MU_IV, SYK_IV, and NUGT_IV which didn't return anything.
I'm not certain if I broke something on my Wealthlab, or if IBKR just doesn't supply the IV for all tickers...
Does IBKR not have _IV for all symbols?
I was trying to get certain IV maps for some symbols and it fails. Specifically, I tried MU_IV, SYK_IV, and NUGT_IV which didn't return anything.
I'm not certain if I broke something on my Wealthlab, or if IBKR just doesn't supply the IV for all tickers...
IV for all symbols, no.
But if they trade options, yes.
All of those tickers work just fine. Make sure:
1. IB selected as a historical provider,
2. you have data permissions for options
But if they trade options, yes.
All of those tickers work just fine. Make sure:
1. IB selected as a historical provider,
2. you have data permissions for options
Thanks @Cone. I suspected as much that "It's me, I'm the problem, it's me"...
Here's my screenshot:
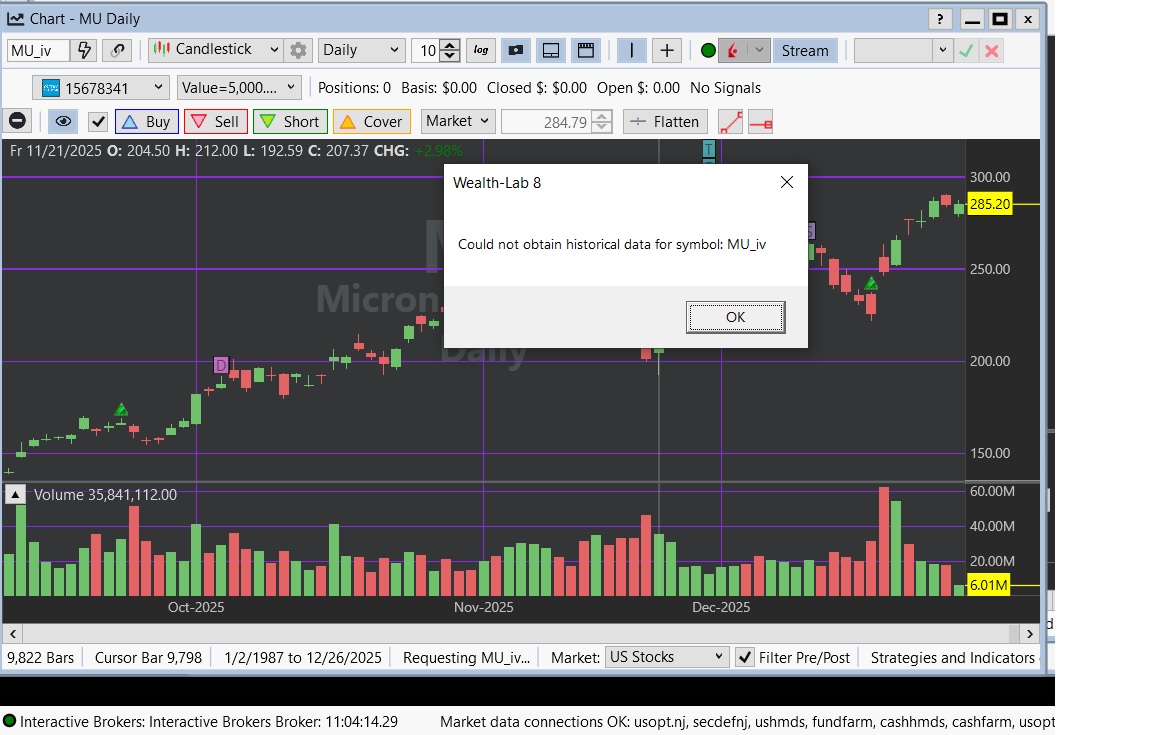
I don't know if I tried to obtain the data when IBKR TWS was not available, and broke something? Is there a way to "force load/re-load" the data? I tried looking in the InteractiveBrokers directory and there was no MU_IV folder to manually delete any corrupted data (there is no data).
Here's my screenshot:
I don't know if I tried to obtain the data when IBKR TWS was not available, and broke something? Is there a way to "force load/re-load" the data? I tried looking in the InteractiveBrokers directory and there was no MU_IV folder to manually delete any corrupted data (there is no data).
You can't "reload" the data because you don't have any for the _IV tickers. But once you have a chart, you can reload with right click > Reload Chart Data from Provider.
Is there any information about the failed requests in the Log Viewer (Ctrl+L)?
Is there any information about the failed requests in the Log Viewer (Ctrl+L)?
I tried many other tickers with _IV. Some worked, some didn't.
Attached is the log.
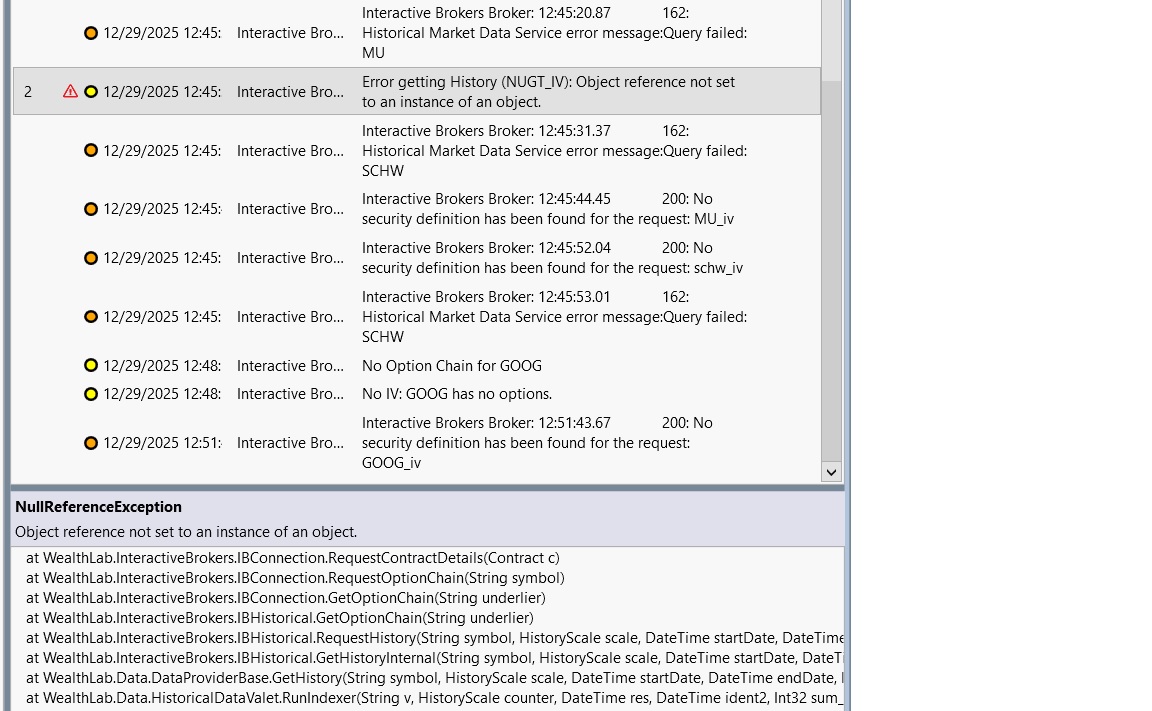
MU_IV still doesn't work. Interestingly, the log said that GOOG didn't work, even though it did.
Attached is the log.
MU_IV still doesn't work. Interestingly, the log said that GOOG didn't work, even though it did.
I can't tell why you're getting that result. Do you have these Data Subscriptions?
1. US Securities Snapshot and Futures Value Bundle $10.00/month (waived if you hit $30 in commissions)
2. US Equity and Options Add-On Streaming Bundle. $4.50/month
If so, make sure you're using the latest builds, restart WealthLab, and try again.
1. US Securities Snapshot and Futures Value Bundle $10.00/month (waived if you hit $30 in commissions)
2. US Equity and Options Add-On Streaming Bundle. $4.50/month
If so, make sure you're using the latest builds, restart WealthLab, and try again.
I actually don't have those subscriptions. But historical data (which is what this is supposed to be) is supposed to be included without subscription. They don't prorate monthly subscriptions, so I may have to try in a few days to see if that resolves the issue. Curious that so many other tickers work, but a few don't...
Your Response
Post
Edit Post
Login is required