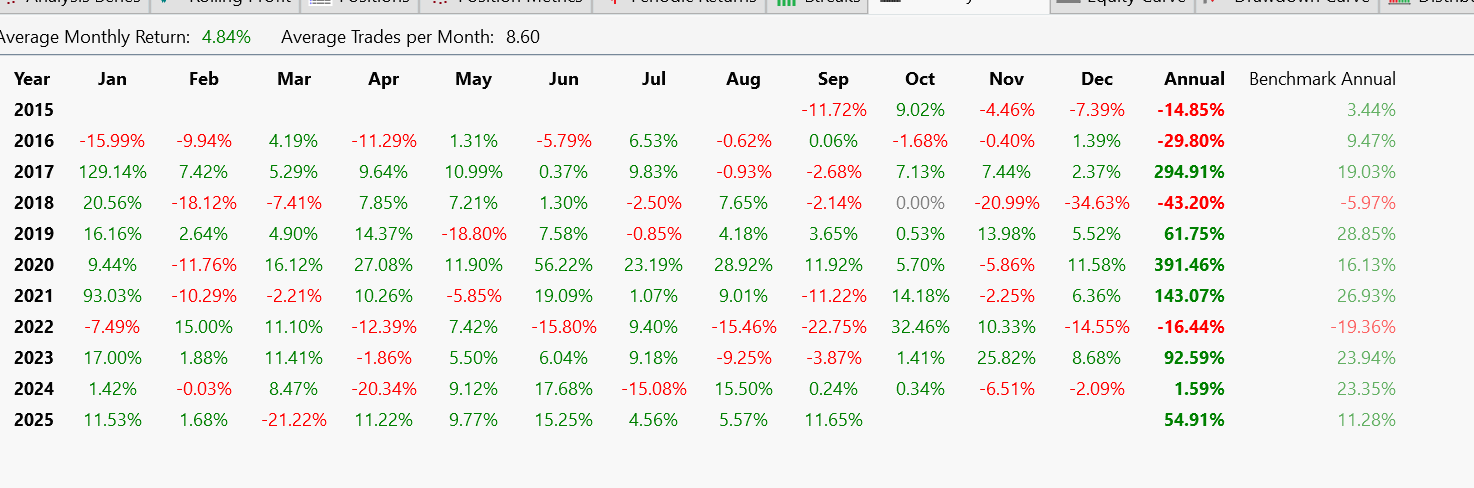
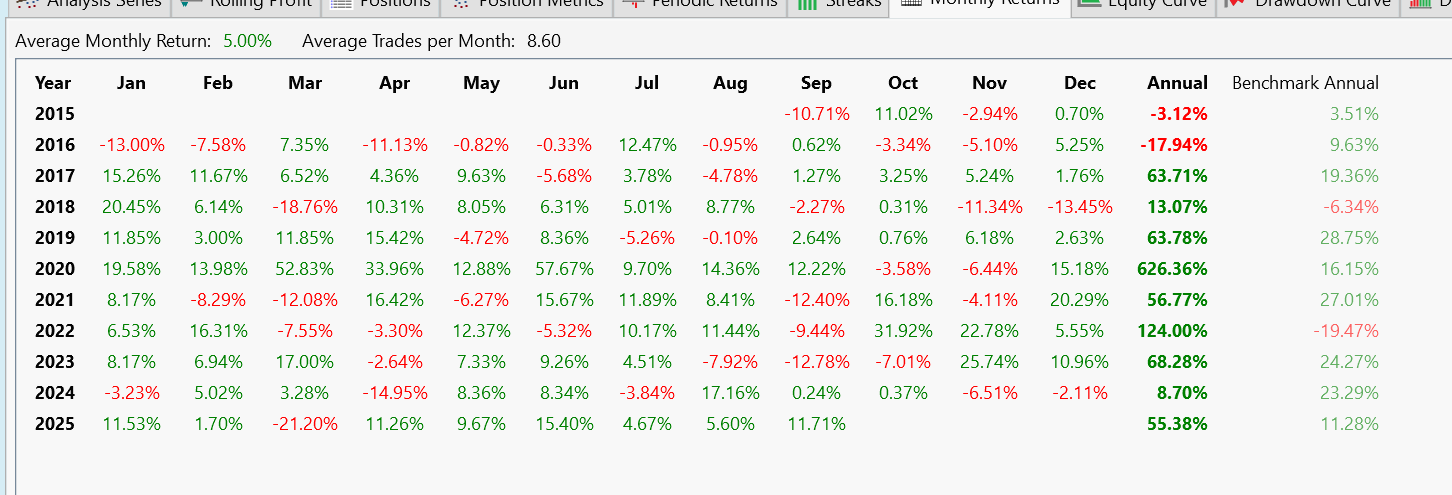
Since the bar data from different data providers/brokers are usually slightly different due to different ways the data are generated. Backtesting for the same strategy on different data could give quite different result. For example, for one version of the one percent TQQQ strategy, with WL data I got a APR of 67% but with IB data for the same setup the APR is 52%. And while WL version gave a +13% positive return for 2018, IB version came out with a huge -43% return. 2022 is another year with huge difference: +124% vs -19%.
Now comes to live trading with IB, which of the above two backtesting results is the one that's closer to the live result?
Now comes to live trading with IB, which of the above two backtesting results is the one that's closer to the live result?
Rename
Wealth-Data is definitely different than other providers (see Support > Faq). It's the best Daily data, no doubt.
Try refreshing your IB chart for TQQQ. Something sounds wrong with it. You might be able to identify a bad range of data using the Data Integrity Tool in the Data Manager.
Try refreshing your IB chart for TQQQ. Something sounds wrong with it. You might be able to identify a bad range of data using the Data Integrity Tool in the Data Manager.
@Cone
You are right, it's a data issue. It's strange that the IB data i used was bad since I just downloaded TQQQ data from IB before I posted this question. Data integrity reported no issue either.
After reload the data from the chart the results are much closer: 67% vs 66%.
You are right, it's a data issue. It's strange that the IB data i used was bad since I just downloaded TQQQ data from IB before I posted this question. Data integrity reported no issue either.
After reload the data from the chart the results are much closer: 67% vs 66%.
Your Response
Post
Edit Post
Login is required