I have a strategy that analyzes a dataset for some info on all symbols for which it executes a bar loop and prints to debug window.
Everything is more or less contained inside the Initialize method (except for some printouts under Cleanup... can be ignored for discussion purposes). The bar loop has a boolean flag so it runs only once.
I added a line of output just to check how many times it runs... that gets printed out (symbol count - 1) times i.e. even after the bar loop is done executing on the 1st symbol the Initialize method still runs through all remaining symbols (as per its design).
Issues:
1. The strategy *only* needs to run on 1 symbol, the bar loop ensures all symbols get processed. Running it on all remaining symbols is unnecessary, time consuming and hogs resources. e.g. if its run on a 1000-symbol dataset, 999 symbols are needlessly cycled through.
2. Adds to debug window clutter (if anything gets printed outside of the bar loop).
Q:
Is there a way to make Initialize(BarHistory bars) method run on ONE bar history only?
Rename
1. Study this BLOG article: https://wealth-lab.com/blog/anatomy-of-a-wl7-strategy
2. Rethink:
* The Initialize Method is designed to run for each symbol. Don't disturb that logic with some boolean variables.
* Probably you should put your logic into the BacktestBegin() method. This runs just once.
* Some other idea: Run your strategy in single symbol mode and access a complete DataSet with the appropriate classes.
There are several ways to achieve what you are trying to do, it depends on the details...
Also: The Debug output does not appear according to the call sequence but is grouped by symbol, so be careful to draw conclusions from that debug output.
Thanks for your response, Dr K.
The boolean variable is inside the bar loop which is a perfectly valid use.
Already tried that, like so:
Problem: It only works on the initial Scale, changing the Scale (which I need to have the option for) doesn't work. (And when you switch back to the original scale, that doesn't work either.)
Hard coding a specific dataset into the code takes away the freedom to change datasets on the fly and see their outputs also.
Actually, after the desired output (info sought in the bar loop) the extra(neous) symbols get printed non-alphabetically... as we all know, the bar histories are processed in a random sequence.
QUOTE:
Don't disturb that logic with some boolean variables.
The boolean variable is inside the bar loop which is a perfectly valid use.
QUOTE:
BacktestBegin() method.
Already tried that, like so:
CODE:
      public override void BacktestBegin()
      {
         var bars = BacktestData[0];
                       // rest of code
Problem: It only works on the initial Scale, changing the Scale (which I need to have the option for) doesn't work. (And when you switch back to the original scale, that doesn't work either.)
QUOTE:
Run your strategy in single symbol mode and access a complete DataSet
Hard coding a specific dataset into the code takes away the freedom to change datasets on the fly and see their outputs also.
QUOTE:
Debug output does not appear according to the call sequence
Actually, after the desired output (info sought in the bar loop) the extra(neous) symbols get printed non-alphabetically... as we all know, the bar histories are processed in a random sequence.
Sammy, a solution is below. Keep in mind that an instance of a strategy is created for each symbol in the dataset being backtested. The following allows you to create per-symbol data (e.g. indicators) in Initialize and then later access that data in the BacktestComplete method, on a per-symbol basis, to perform the global analysis. See the code comments for more details...
CODE:
using System.Collections.Concurrent;
using WealthLab.Backtest;
using WealthLab.Core;
using WealthLab.Indicators;

namespace WealthLabStrategies.Analysis
{
    /// <summary>
    ///     GlobalExecutionStrategy demonstrates a pattern for sharing and aggregating per-symbol strategy data
    ///     across all symbols in a Wealth-Lab 8 backtest.
    ///     Important: An instance of GlobalExecutionStrategy is created for each symbol in the dataset. That is
    ///     the way Wealth-Lab works with strategies.
    ///     Each instance operates independently for its assigned symbol.
    ///     Each symbol's strategy instance registers itself in a static ConcurrentDictionary keyed by symbol. This allows the
    ///     BacktestComplete method, which is called once after all symbols have been processed, to access all strategy
    ///     instances and their calculated indicator values. This scheme enables global analysis or reporting that requires
    ///     access to per-symbol results, such as aggregating indicator values, cross-symbol comparisons, or custom
    ///     portfolio-level logic.
    /// </summary>
    public class GlobalExecutionStrategy : UserStrategyBase
    {
        /// <summary>
        ///     Static dictionary to hold a reference to each GlobalExecutionStrategy instance, keyed by symbol.
        ///     This enables access to all per-symbol strategy instances and their calculated values from static/global
        ///     methods such as BacktestComplete. It is cleared at the start of each backtest to avoid stale data.
        /// </summary>
        private static readonly ConcurrentDictionary<string, GlobalExecutionStrategy> StrategyInstances = new();

        // Example: store indicator for a symbol
        private SMA _sma;

        public override void Initialize(BarHistory bars)
        {
            // Register this instance for the current symbol
            StrategyInstances[bars.Symbol] = this;

            // Example: calculate and store an indicator value for the symbol
            _sma = SMA.Series(bars.Close, 14);

            //WriteToDebugLog($"GlobalExecutionStrategy initialized for symbol {bars.Symbol}", false);
        }

        public override void Execute(BarHistory bars, int idx)
        {
        }

        public override void BacktestBegin()
        {
            // Clear StrategyInstances at the start of each backtest to avoid stale data
            StrategyInstances.Clear();
        }

        public override void BacktestComplete()
        {
            // Access all strategy (symbol) instances and their indicator values
            // This enables global logic such as aggregation or cross-symbol analysis
            foreach (var (symbol, strategyInstance) in StrategyInstances)
            {
                var bars = strategyInstance.CurrentBars; // Local variable for BarHistory
                WriteToDebugLog(
                    $"Symbol: {symbol}, Last SMA(14) at last bar: {strategyInstance._sma[^1]:0.00}, Scale: {bars.Scale}",
                    false);
            }
        }
    }
}
@Paul1986,
Thanks for the code - learnt some new stuff today!!
Using your code as framework, I moved the bar loop from Initialize into BacktestComplete section. It worked in the sense that I could see the expected output in the debug window.
BUT...
The TimeSeries don't plot. The empty series are created under Initialize method using (bars.DateTimes) and are populated inside the bar loop - now under BacktestComplete. So they can't be plotted under Initialize, and they also don't plot under BacktestComplete. Is there a solution to this?
What you are trying to achieve for output is vague to me. Can you provide a basic outline of the loop's logic so I can get a better grasp on your expected output?
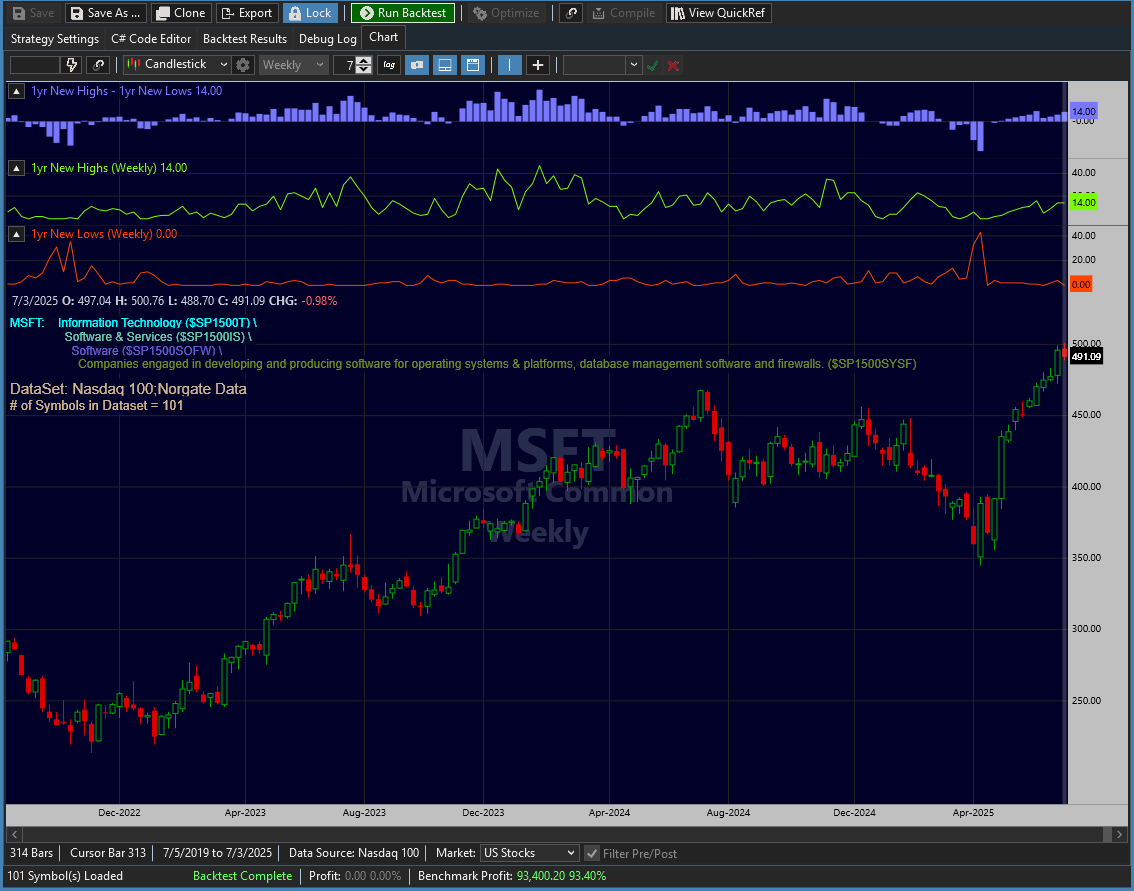
The strategy looks for stocks making 1yr highs or lows in a dataset. Their number is tabulated and plotted as timeseries in the chart window. Further analysis of the new highs/lows is done for GICS info - this requires Norgate Data for GICS metadata. The GICS breakdown is printed to the debug window.
In summary, there are 2 outputs - the new highs/lows timeseries in the Chart window and the GICS breakdown (for the last bar) in the debug window.
The FULL code is below. If you don't use Norgate data you can delete/hide all GICS-related code and simply focus on why the timeseries aren't plotting. Run it on a dataset of your choice - DOW 30, Nasdaq 100, etc. I'm probably overlooking something simple.
CODE:
using WealthLab.Backtest;
using System;
using WealthLab.Core;
using WealthLab.Indicators;
using System.Drawing;
using System.Collections.Generic;
using System.Linq;
using WealthLab.Norgate;
using System.Collections.Concurrent;


namespace WealthScript6
{
   public class GlobalExecutionStrategy : UserStrategyBase
    {
      //declare private variables below
      private static readonly ConcurrentDictionary<string, GlobalExecutionStrategy> StrategyInstances = new();
      private string dsName;
      private WealthLab.Core.DataSet ds;
      private DateTime LastDate_DS;
      private int oneYr;
      private TimeSeries _52WeekNH, _52WeekNL, _52WeekHminusL, high, low;
      private bool ranOnce = false;
      private static bool outputPrinted = false;

      // Create lists that will hold the necessary gics info
      private List<gicsHolder> NewHiSctrList = new List<gicsHolder>();
      private List<gicsHolder> NewHiIGrpList = new List<gicsHolder>();
      private List<gicsHolder> NewHiInduList = new List<gicsHolder>();
      private List<gicsHolder> NewHiSIndList = new List<gicsHolder>();
      private List<gicsHolder> NewLoSctrList = new List<gicsHolder>();
      private List<gicsHolder> NewLoIGrpList = new List<gicsHolder>();
      private List<gicsHolder> NewLoInduList = new List<gicsHolder>();
      private List<gicsHolder> NewLoSIndList = new List<gicsHolder>();

      //create indicators and other objects here
      public override void Initialize(BarHistory bars)
      {
         // Register this instance for the current symbol
         StrategyInstances[bars.Symbol] = this;

         // Pane drawing options
         SetPaneDrawingOptions("Price", 100, 50);

         ChartDisplaySettings cds = new ChartDisplaySettings();
         cds.ShowVolumePane = false;     //hide volume pane
         cds.PaneSeparatorWidth = 0;     //hide pane separator lines
         SetChartDrawingOptions(cds);    //put above settings into effect
         ///------------------------------

         // Plot GICS info of clicked symbol in Price Pane
         string Symbol = bars.Symbol;
         char tab = '\t';

         // From Norgate Data metadata
         string gics = Metadata.ClassificationAtLevel(Symbol, "GICS", 1);   //see if any GICS data is available for symbol
         if (!string.IsNullOrEmpty(gics))
         {
            string sector = Metadata.CorrespondingIndustryIndex(Symbol, "$SP1500", 1, "PR");
            string industrygroup = Metadata.CorrespondingIndustryIndex(Symbol, "$SP1500", 2, "PR");
            string industry = Metadata.CorrespondingIndustryIndex(Symbol, "$SP1500", 3, "PR");
            string subindustry = Metadata.CorrespondingIndustryIndex(Symbol, "$SP1500", 4, "PR");

            string sector_name = Metadata.ClassificationDescriptionAtLevel(Symbol, "GICS", 1);
            string industrygroup_name = Metadata.ClassificationDescriptionAtLevel(Symbol, "GICS", 2);
            string industry_name = Metadata.ClassificationDescriptionAtLevel(Symbol, "GICS", 3);
            string subindustry_name = Metadata.ClassificationDescriptionAtLevel(Symbol, "GICS", 4);

            DrawHeaderText(Symbol + ": " + tab + sector_name + " (" + sector + ") \\ ", WLColor.Aqua, 12);
            DrawHeaderText(tab + "  " + industrygroup_name + " (" + industrygroup + ") \\ ", WLColor.MediumAquamarine, 12);
            DrawHeaderText(tab + "    " + industry_name + " (" + industry + ") \\ ", WLColor.SlateBlue, 12);
            DrawHeaderText(tab + "      " + subindustry_name + " (" + subindustry + ") ", WLColor.OliveDrab, 12);
         }
         else
         {
            DrawHeaderText(Symbol + ": No GICS info available", WLColor.Red, 12);
         }
         DrawHeaderText(" ");
         //----------

         if (bars.Scale == HistoryScale.Daily) { oneYr = 252; }
         else if (bars.Scale == HistoryScale.Weekly) { oneYr = 52; }
         else if (bars.Scale == HistoryScale.Monthly) { oneYr = 12; }
         else
         {
            DrawHeaderText("Change Scale to Daily, Weekly or Monthly", WLColor.Fuchsia, 24);
            return;
         }
         StartIndex = oneYr + 1;

         _52WeekNH = new TimeSeries(bars.DateTimes, 0) { Description = "1yr New Highs (" + bars.Scale.ToString() + ")" };
         _52WeekNL = new TimeSeries(bars.DateTimes, 0) { Description = "1yr New Lows (" + bars.Scale.ToString() + ")" };

         DrawHeaderText(" ");
         dsName = ExecutionDataSetName;
         if (dsName == null)
         {
            DrawHeaderText("Single Symbol: " + bars.Symbol, WLColor.LightGray, 12);
            return;
         }
         else
         {
            ds = WLHost.Instance.FindDataSet(dsName);
            DrawHeaderText("DataSet: " + dsName, WLColor.Tan, 15);
            DrawHeaderText("# of Symbols in Dataset = " + ds.Symbols.Count, WLColor.Tan, 13);
         //   WriteToDebugLog("DataSet: " + dsName);
         //   WriteToDebugLog("# of Symbols in Dataset = " + ds.Symbols.Count);
         }

         // Abort if it's not a Norgate dataset, Norgate provides GICS info for its own symbols only
         if (!dsName.Contains("Norgate"))
         {
            DrawHeaderText("Strategy terminated as it only works with Norgate datasets!", WLColor.NeonFuschia, 15);
            return;
         }

         NewHiSctrList.Clear(); NewHiIGrpList.Clear(); NewHiInduList.Clear(); NewHiSIndList.Clear();
         NewLoSctrList.Clear(); NewLoIGrpList.Clear(); NewLoInduList.Clear(); NewLoSIndList.Clear();

      }


      public override void Execute(BarHistory bars, int idx)
        { }

      public override void BacktestBegin()
      {
         // Clear StrategyInstances at the start of each backtest to avoid stale data
         StrategyInstances.Clear();
      }


      public override void Cleanup(BarHistory bars)
      {
      }

      public override void BacktestComplete()
      {
         // Access all strategy (symbol) instances and their indicator values
         // This enables global logic such as aggregation or cross-symbol analysis
         foreach (var (sym, strategyInstance) in StrategyInstances)
         {
            var bars = strategyInstance.CurrentBars; // Local variable for BarHistory
            try
            {
               WriteToStatusBar("Processing " + sym); // chk
               BarHistory bh = GetHistory(bars, sym); // synched with plotted symbol's bars
               //bh.ClearCache();
               high = bh.High;
               low = bh.Low;
               int firstValidBar = high.FirstValidIndex;
               int lastBar = bh.Count - 1;
               if (bh.Count >= firstValidBar + StartIndex) //symbol has enough data
               {
                  TimeSeries HH1yr = Highest.Series(high, oneYr);
                  TimeSeries LL1yr = Lowest.Series(low, oneYr);
                  for (int bar = firstValidBar + StartIndex; bar < bh.Count; bar++)
                  {
                     if (high[bar] == HH1yr[bar])
                     {
                        _52WeekNH[bar] += 1;
                        // On last bar (only) analyze NewHi for GICS info
                        if (bar == lastBar)
                        {
                           string _gics = Metadata.ClassificationAtLevel(sym, "GICS", 1);  //chk if any GICS data is available
                           if (!string.IsNullOrEmpty(_gics))
                           {
                              //WriteToDebugLog(sym + " made a New High on last bar");   // check
                              string sctr = Metadata.CorrespondingIndustryIndex(sym, "$SP1500", 1, "PR");
                              string sector_name = Metadata.ClassificationDescriptionAtLevel(sym, "GICS", 1);
                              string igrp = Metadata.CorrespondingIndustryIndex(sym, "$SP1500", 2, "PR");
                              string industrygroup_name = Metadata.ClassificationDescriptionAtLevel(sym, "GICS", 2);
                              string indu = Metadata.CorrespondingIndustryIndex(sym, "$SP1500", 3, "PR");
                              string industry_name = Metadata.ClassificationDescriptionAtLevel(sym, "GICS", 3);
                              string sind = Metadata.CorrespondingIndustryIndex(sym, "$SP1500", 4, "PR");
                              string subindustry_name = Metadata.ClassificationDescriptionAtLevel(sym, "GICS", 4);

                              // Sectors
                              var holderSC = NewHiSctrList.Find(gh1 => gh1.gics == sctr);
                              if (holderSC != null)
                                 holderSC.gicsList.Add(sym);
                              else
                                 NewHiSctrList.Add(new gicsHolder { gics = sctr, gicsDescription = sector_name, gicsList = new List<string> { sym } });

                              // Industry Groups
                              var holderIG = NewHiIGrpList.Find(gh1 => gh1.gics == igrp);
                              if (holderIG != null)
                                 holderIG.gicsList.Add(sym);
                              else
                                 NewHiIGrpList.Add(new gicsHolder { gics = igrp, gicsDescription = industrygroup_name, gicsList = new List<string> { sym } });

                              // Industries
                              var holderIN = NewHiInduList.Find(gh1 => gh1.gics == indu);
                              if (holderIN != null)
                                 holderIN.gicsList.Add(sym);
                              else
                                 NewHiInduList.Add(new gicsHolder { gics = indu, gicsDescription = industry_name, gicsList = new List<string> { sym } });

                              // SubIndustries
                              var holderSI = NewHiSIndList.Find(gh1 => gh1.gics == sind);
                              if (holderSI != null)
                                 holderSI.gicsList.Add(sym);
                              else
                                 NewHiSIndList.Add(new gicsHolder { gics = sind, gicsDescription = subindustry_name, gicsList = new List<string> { sym } });
                           }
                        } // NewHi GICS analysis
                     }
                     if (low[bar] == LL1yr[bar])
                     {
                        _52WeekNL[bar] += 1;
                        // On last bar (only) analyze NewLo for GICS info
                        if (bar == lastBar)
                        {
                           string _gics = Metadata.ClassificationAtLevel(sym, "GICS", 1);  //chk if any GICS data is available
                           if (!string.IsNullOrEmpty(_gics))
                           {
                              //WriteToDebugLog(sym + " made a New Low on last bar");   // check
                              string sctr = Metadata.CorrespondingIndustryIndex(sym, "$SP1500", 1, "PR");
                              string sector_name = Metadata.ClassificationDescriptionAtLevel(sym, "GICS", 1);
                              string igrp = Metadata.CorrespondingIndustryIndex(sym, "$SP1500", 2, "PR");
                              string industrygroup_name = Metadata.ClassificationDescriptionAtLevel(sym, "GICS", 2);
                              string indu = Metadata.CorrespondingIndustryIndex(sym, "$SP1500", 3, "PR");
                              string industry_name = Metadata.ClassificationDescriptionAtLevel(sym, "GICS", 3);
                              string sind = Metadata.CorrespondingIndustryIndex(sym, "$SP1500", 4, "PR");
                              string subindustry_name = Metadata.ClassificationDescriptionAtLevel(sym, "GICS", 4);

                              // Sectors
                              var holderSC = NewLoSctrList.Find(gh1 => gh1.gics == sctr);
                              if (holderSC != null)
                                 holderSC.gicsList.Add(sym);
                              else
                                 NewLoSctrList.Add(new gicsHolder { gics = sctr, gicsDescription = sector_name, gicsList = new List<string> { sym } });

                              // Industry Groups
                              var holderIG = NewLoIGrpList.Find(gh1 => gh1.gics == igrp);
                              if (holderIG != null)
                                 holderIG.gicsList.Add(sym);
                              else
                                 NewLoIGrpList.Add(new gicsHolder { gics = igrp, gicsDescription = industrygroup_name, gicsList = new List<string> { sym } });

                              // Industries
                              var holderIN = NewLoInduList.Find(gh1 => gh1.gics == indu);
                              if (holderIN != null)
                                 holderIN.gicsList.Add(sym);
                              else
                                 NewLoInduList.Add(new gicsHolder { gics = indu, gicsDescription = industry_name, gicsList = new List<string> { sym } });

                              // SubIndustries
                              var holderSI = NewLoSIndList.Find(gh1 => gh1.gics == sind);
                              if (holderSI != null)
                                 holderSI.gicsList.Add(sym);
                              else
                                 NewLoSIndList.Add(new gicsHolder { gics = sind, gicsDescription = subindustry_name, gicsList = new List<string> { sym } });
                           }
                        } // NewLo GICS analysis
                     }
                  } // bar loop
               }
               else
                  continue;
            }
            catch (Exception e)
            {
               WriteToDebugLog(sym + " " + e.Message);
               continue;
            }

         }

         // Plots
         SetPaneDrawingOptions("pNH", 13, 35);
         PlotTimeSeriesLine(_52WeekNH, _52WeekNH.Description, "pNH", WLColor.LawnGreen, 1, LineStyle.Solid);

         SetPaneDrawingOptions("pNL", 13, 40);
         PlotTimeSeriesLine(_52WeekNL, _52WeekNL.Description, "pNL", WLColor.OrangeRed, 1, LineStyle.Solid);

         _52WeekHminusL = _52WeekNH - _52WeekNL;
         _52WeekHminusL.Description = "1yr New Highs - 1yr New Lows";
         SetPaneDrawingOptions("pHL", 15, 25);
         PlotTimeSeries(_52WeekHminusL, _52WeekHminusL.Description, "pHL", WLColor.Blue, PlotStyle.ThickHistogram);


         if (!outputPrinted)
         {
            // New Highs - Sector info
            List<string> sectorNewHi = OutputSortedListToList.GenerateOutput(this, "New Highs, by Sector", NewHiSctrList);
            foreach (var line in sectorNewHi)
            { WriteToDebugLog(line); }
            // New Highs - Industry Group info
            List<string> indGrpNewHi = OutputSortedListToList.GenerateOutput(this, "New Highs, by Industry Group", NewHiIGrpList);
            foreach (var line in indGrpNewHi)
            { WriteToDebugLog(line); }

            // New Lows - Sector info
            List<string> sectorNewLo = OutputSortedListToList.GenerateOutput(this, "New Lows, by Sector", NewLoSctrList);
            foreach (var line in sectorNewLo)
            { WriteToDebugLog(line); }
            // New Lows - Industry Group info
            List<string> indGrpNewLo = OutputSortedListToList.GenerateOutput(this, "New Lows, by Industry Group", NewLoIGrpList);
            foreach (var line in indGrpNewLo)
            { WriteToDebugLog(line); }

            // Add more printouts, as needed

            outputPrinted = true;
         }

      }
   }


   //============================================================

   public class gicsHolder
   {
      public string gics;
      public string gicsDescription;
      public List<string> gicsList = new List<string>();
   }

   public class OutputSortedListToList
   {
      private UserStrategyBase obj;

      public static List<string> GenerateOutput(UserStrategyBase obj, string Header, List<gicsHolder> List)
      {
         var outputList = new List<string>();
         if (List.Count > 0)
         {
            var sortedList = List.OrderBy(h => h.gics).ToList();

            // Calculate max widths
            int gicsWidth = "GICS".Length, descWidth = "Description".Length, symbolWidth = "Symbol".Length;
            foreach (var holder in List)
            {
               gicsWidth = Math.Max(gicsWidth, holder.gics?.Length ?? 0);
               descWidth = Math.Max(descWidth, holder.gicsDescription?.Length ?? 0);
               foreach (var symbol in holder.gicsList)
                  symbolWidth = Math.Max(symbolWidth, symbol?.Length ?? 0);
            }
            // Add padding
            gicsWidth += 2; descWidth += 2; symbolWidth += 2;

            outputList.Add("");
            outputList.Add("// " + Header);
            outputList.Add($"{"GICS".PadRight(gicsWidth)}{"Description".PadRight(descWidth)}{"Symbol".PadRight(symbolWidth)}");
            outputList.Add($"{new string('-', gicsWidth)}{new string('-', descWidth)}{new string('-', symbolWidth)}");

            foreach (var holder in sortedList)
            {
               foreach (var symbol in holder.gicsList)
               {
                  outputList.Add(
                     $"{holder.gics.PadRight(gicsWidth)}" +
                     $"{holder.gicsDescription.PadRight(descWidth)}" +
                     $"{symbol.PadRight(symbolWidth)}"
                  );
               }
               outputList.Add("");
            }
         }
         return outputList;
      }
   }

}
Sammy, I understand that _52WeekNH is incremented when the current bar's high is equal to the "highest" series current bar. That's clear. But, is your intent to:
1) count and graph matching high counts on a per-symbol basis, or
2) check for equal highs per symbol but the tally (count) is accumulated in _52WeekNH across all symbols. But, you want to graph the counts on each symbol's chart (for, say, convenience of analysis)
The same can be said for the lows.
Aside from the above, is it your intent to create/append to a "GICS report" only if the last bar's high just happens to be equal to the series highest? That would seem random, but maybe you only want that output generated when a symbol achieves a new or equal high at the last bar. Same for the lows.
The purpose of the strategy is 2-fold:
1. Count the number of 1yr highs/lows made across a dataset and plot that as timeseries. One can use daily, weekly or monthly scale.
2. Create a GICS report of the symbols making such new highs/lows on the last bar.
When the code was in Initialize method both the timeseries and GICS analysis were working fine - except for the redundancies I noted in the initial post which were slowing it somewhat (noticeable when run on large datasets)... hence this post.
Now that the code is in BacktestComplete section, the plots don't plot but the GICS analysis of last bar's new highs/lows is working fine.
Let's just focus on why the timeseries aren't plotting. It should look like this (this is from the older, all-code-in-Initialize-method version; Nasdaq 100, data till 7/2/25, Weekly scale):
Instead, with the code in BacktestComplete, the timeseries don't plot:
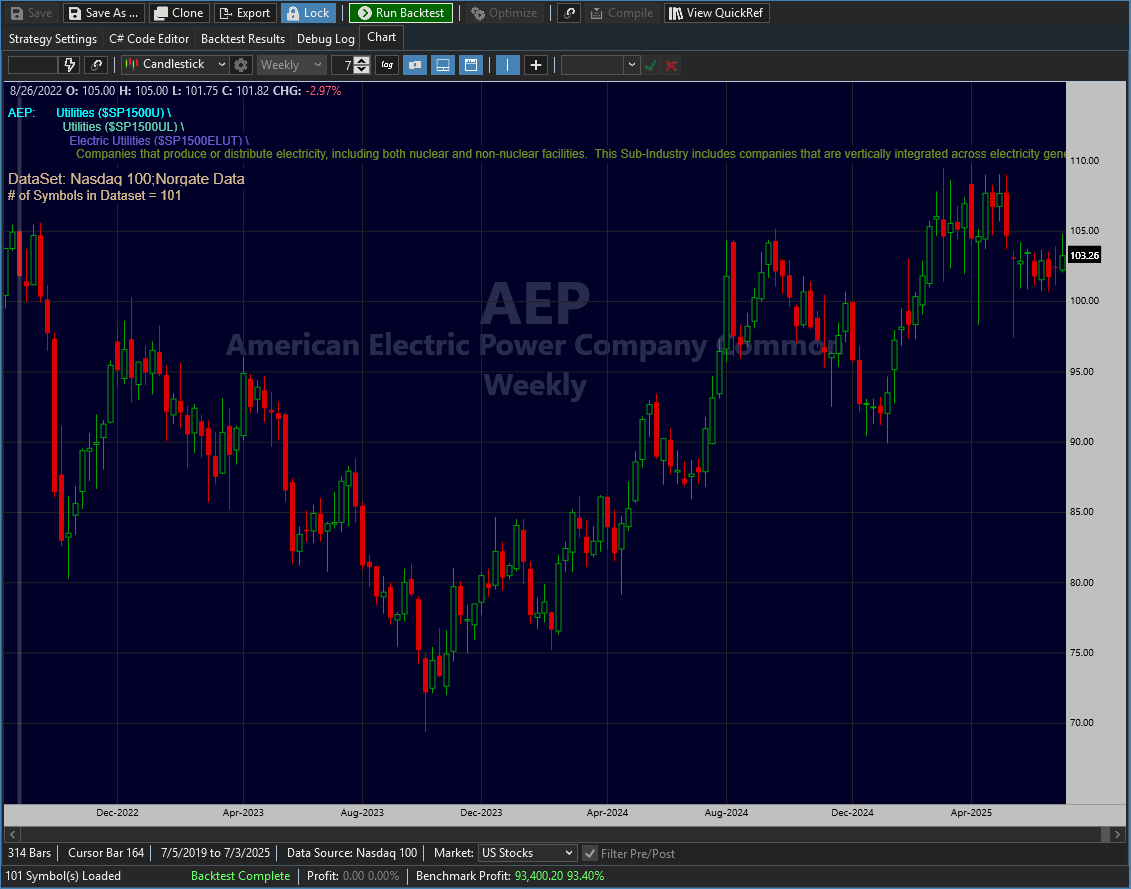
They don't even plot with the baseline value of 0.
1. Count the number of 1yr highs/lows made across a dataset and plot that as timeseries. One can use daily, weekly or monthly scale.
2. Create a GICS report of the symbols making such new highs/lows on the last bar.
When the code was in Initialize method both the timeseries and GICS analysis were working fine - except for the redundancies I noted in the initial post which were slowing it somewhat (noticeable when run on large datasets)... hence this post.
Now that the code is in BacktestComplete section, the plots don't plot but the GICS analysis of last bar's new highs/lows is working fine.
Let's just focus on why the timeseries aren't plotting. It should look like this (this is from the older, all-code-in-Initialize-method version; Nasdaq 100, data till 7/2/25, Weekly scale):
Instead, with the code in BacktestComplete, the timeseries don't plot:
They don't even plot with the baseline value of 0.
The problem with the plotting is two-fold:
1. You need to use the symbol's strategy instance to have the plot show up for the symbol
2. You need to synchronize the 52 week highs/lows time series with the symbol's datetimes.
Here is the code you need in BacktestComplete to do the plots...
1. You need to use the symbol's strategy instance to have the plot show up for the symbol
2. You need to synchronize the 52 week highs/lows time series with the symbol's datetimes.
Here is the code you need in BacktestComplete to do the plots...
CODE:
        // Plots
        foreach (var strategyInstance in StrategyInstances.Values)
        {
            // Synchronize the global _52WeekNH and _52WeekNL series to the current symbol's BarHistory.
            // This ensures the time series aligns with the bars of the symbol being plotted,
            // so that the plot displays correctly even if the symbol has missing or different dates.
            var _52NHSynch = TimeSeriesSynchronizer.Synchronize(_52WeekNH, strategyInstance.CurrentBars);
            var _52NLSynch = TimeSeriesSynchronizer.Synchronize(_52WeekNL, strategyInstance.CurrentBars);

            strategyInstance.SetPaneDrawingOptions("pNH", 13, 35);
            strategyInstance.PlotTimeSeriesLine(_52NHSynch, _52WeekNH.Description, "pNH", WLColor.LawnGreen, 1);

            strategyInstance.SetPaneDrawingOptions("pNL", 13, 40);
            strategyInstance.PlotTimeSeriesLine(_52NLSynch, _52WeekNL.Description, "pNL", WLColor.OrangeRed, 1);

            // The difference series is also synchronized to the current symbol's bars for correct plotting.
            _52WeekHminusL = _52NHSynch - _52NLSynch;
            _52WeekHminusL.Description = "1yr New Highs - 1yr New Lows";
            strategyInstance.SetPaneDrawingOptions("pHL", 15, 25);
            strategyInstance.PlotTimeSeries(_52WeekHminusL, _52WeekHminusL.Description, "pHL", WLColor.Blue, PlotStyle.ThickHistogram);
        }
- Plots working OK now
- There are very significant time savings on running it on large datasets (cf my old version).
Paul, YOU ROCK!!
Many thanks!
- There are very significant time savings on running it on large datasets (cf my old version).
Paul, YOU ROCK!!
Many thanks!
Sammy, you're welcome. I've been trying-out GitHub Copilot's integrated edit feature. So, I told it to:
Refactor the code so that logic is compartmentalized into some new methods.
Comment the code.
Move some logic out of BacktestComplete into Initialize (like counting). This is possible because in a strategy backtest there is not simultaneous (multi-threaded) execution of symbols.
Class is now named GlobalExec (incase you want to keep your current version for comparison.)
Stub the Metadata class because I don't use Norgate. You can just get rid of it (at the end of the code) and put back the using for WealthLab.Norgate.
Column width calculations are now done in LINQ.
Commented-out the Norgate check in Initialize().
It was easy to do this with AI. I just had to tell it what I wanted and it would automagically adjust the code. For example the refactoring would have been quite tedious, but it did it in about 30 seconds. The edit feature is sweet.
CODE:
using System; using System.Collections.Generic; using System.Linq; using WealthLab.Backtest; using WealthLab.Core; using WealthLab.Indicators; //using WealthLab.Norgate; // ReSharper disable InconsistentNaming namespace WealthScript6 { /// <summary> /// GlobalExec demonstrates a pattern for sharing and aggregating per-symbol strategy data /// across all symbols in a Wealth-Lab backtest. /// An instance of GlobalExec is created for each symbol in the dataset. /// Each instance operates independently for its assigned symbol and registers itself in a static /// ConcurrentDictionary keyed by symbol. This allows the BacktestComplete method, which is called once after /// all symbols have been processed, to access all strategy instances and their calculated indicator values. /// This scheme enables global analysis or reporting that requires access to per-symbol results, such as /// aggregating indicator values, cross-symbol comparisons, or custom portfolio-level logic. /// </summary> public class GlobalExec : UserStrategyBase { // Static dictionary to hold a reference to each GlobalExec instance, keyed by symbol. // This enables access to all per-symbol strategy instances and their calculated values from static/global // methods such as BacktestComplete. It is cleared at the start of each backtest to avoid stale data. private static readonly Dictionary<string, GlobalExec> StrategyInstances = new(); // TimeSeries for tracking new highs, new lows private static TimeSeries _52WeekNH, _52WeekNL; // Static flag to ensure _52WeekNH and _52WeekNL are only initialized once per run private static bool _globalSeriesInitialized; // Lists to hold GICS information for new highs and new lows (static: shared across all symbols) private static readonly List<gicsHolder> NewHiIGrpList = []; private static readonly List<gicsHolder> NewHiInduList = []; private static readonly List<gicsHolder> NewHiSctrList = []; private static readonly List<gicsHolder> NewHiSIndList = []; private static readonly List<gicsHolder> NewLoIGrpList = []; private static readonly List<gicsHolder> NewLoInduList = []; private static readonly List<gicsHolder> NewLoSctrList = []; private static readonly List<gicsHolder> NewLoSIndList = []; // DataSet and related info private DataSet ds; private string dsName; private int oneYr; // Initialize is called once per symbol instance public override void Initialize(BarHistory bars) { // Register this instance for the current symbol StrategyInstances[bars.Symbol] = this; // Output the current thread id for debugging //WriteToDebugLog($"Initialize called on Thread ID: {Thread.CurrentThread.ManagedThreadId}"); // Ensure _52WeekNH and _52WeekNL are only initialized once per run, using the first symbol's bars // Locking is not necessary because Wealth-Lab 8 does not use multiple threads when running a strategy // (Strategy optimization may be done in parallel, but it is unlikely this strategy would ever be optimized.) if (!_globalSeriesInitialized) { _52WeekNH = new TimeSeries(bars.DateTimes, 0) {Description = "1yr New Highs (" + bars.Scale + ")"}; _52WeekNL = new TimeSeries(bars.DateTimes, 0) {Description = "1yr New Lows (" + bars.Scale + ")"}; _globalSeriesInitialized = true; } // Set up chart pane and display options SetPaneDrawingOptions("Price", 100); var cds = new ChartDisplaySettings { ShowVolumePane = false, // Hide volume pane PaneSeparatorWidth = 0 // Hide pane separator lines }; SetChartDrawingOptions(cds); // Apply chart settings // Plot GICS info of clicked symbol in Price Pane var symbol = bars.Symbol; var tab = '\t'; // Retrieve GICS metadata for the symbol (stubbed in Metadata class) var gics = Metadata.ClassificationAtLevel(symbol, "GICS", 1); // See if any GICS data is available for symbol if (!string.IsNullOrEmpty(gics)) { // Retrieve sector, industry group, industry, and subindustry info var sector = Metadata.CorrespondingIndustryIndex(symbol, "$SP1500", 1, "PR"); var industrygroup = Metadata.CorrespondingIndustryIndex(symbol, "$SP1500", 2, "PR"); var industry = Metadata.CorrespondingIndustryIndex(symbol, "$SP1500", 3, "PR"); var subindustry = Metadata.CorrespondingIndustryIndex(symbol, "$SP1500", 4, "PR"); var sector_name = Metadata.ClassificationDescriptionAtLevel(symbol, "GICS", 1); var industrygroup_name = Metadata.ClassificationDescriptionAtLevel(symbol, "GICS", 2); var industry_name = Metadata.ClassificationDescriptionAtLevel(symbol, "GICS", 3); var subindustry_name = Metadata.ClassificationDescriptionAtLevel(symbol, "GICS", 4); // Display GICS hierarchy in the chart header DrawHeaderText(symbol + ": " + tab + sector_name + " (" + sector + ") \\ ", WLColor.Aqua, 12); DrawHeaderText(tab + " " + industrygroup_name + " (" + industrygroup + ") \\ ", WLColor.MediumAquamarine, 12); DrawHeaderText(tab + " " + industry_name + " (" + industry + ") \\ ", WLColor.SlateBlue, 12); DrawHeaderText(tab + " " + subindustry_name + " (" + subindustry + ") ", WLColor.OliveDrab, 12); } else { DrawHeaderText(symbol + ": No GICS info available", WLColor.Red, 12); } DrawHeaderText(" "); //---------- // Determine the number of bars in one year based on the chart scale if (bars.Scale == HistoryScale.Daily) { oneYr = 252; } else if (bars.Scale == HistoryScale.Weekly) { oneYr = 52; } else if (bars.Scale == HistoryScale.Monthly) { oneYr = 12; } else { DrawHeaderText("Change Scale to Daily, Weekly or Monthly", WLColor.Fuchsia, 24); return; } // Set the start index for calculations StartIndex = oneYr + 1; DrawHeaderText(" "); dsName = ExecutionDataSetName; if (dsName == null) { DrawHeaderText("Single Symbol: " + bars.Symbol, WLColor.LightGray, 12); return; } ds = WLHost.Instance.FindDataSet(dsName); DrawHeaderText("DataSet: " + dsName, WLColor.Tan, 15); DrawHeaderText("# of Symbols in Dataset = " + ds.Symbols.Count, WLColor.Tan, 13); // WriteToDebugLog("DataSet: " + dsName); // WriteToDebugLog("# of Symbols in Dataset = " + ds.Symbols.Count); // Abort if it's not a Norgate dataset, Norgate provides GICS info for its own symbols only //if (!dsName.Contains("Norgate")) //{ //DrawHeaderText("Strategy terminated as it only works with Norgate datasets!", WLColor.NeonFuschia, 15); //return; //} ProcessSymbol(bars); } // No per-bar logic in this strategy public override void Execute(BarHistory bars, int idx) { } // Called once at the start of the backtest public override void BacktestBegin() { // Clear StrategyInstances at the start of each backtest to avoid stale data StrategyInstances.Clear(); // Reset and re-initialize the static TimeSeries and flag for each run _globalSeriesInitialized = false; _52WeekNH = null; _52WeekNL = null; // Clear all static GICS lists at the start of each run NewHiIGrpList.Clear(); NewHiInduList.Clear(); NewHiSctrList.Clear(); NewHiSIndList.Clear(); NewLoIGrpList.Clear(); NewLoInduList.Clear(); NewLoSctrList.Clear(); NewLoSIndList.Clear(); } // Called once after all symbols have been processed public override void BacktestComplete() { // Plot the synchronized time series for each symbol PlotAll(); PrintSectorAndIndustryOutputs(); } /// <summary> /// Processes a single symbol's data for new highs/lows and GICS analysis. /// </summary> private void ProcessSymbol(BarHistory bars) { var sym = bars.Symbol; try { WriteToStatusBar("Processing " + sym); // Update status bar var bh = GetHistory(bars, sym); // Synched with plotted symbol's bars var high = bh.High; var low = bh.Low; var firstValidBar = high.FirstValidIndex; var lastBar = bh.Count - 1; if (bh.Count >= firstValidBar + StartIndex) // Symbol has enough data { TimeSeries HH1yr = Highest.Series(high, oneYr); TimeSeries LL1yr = Lowest.Series(low, oneYr); for (var bar = firstValidBar + StartIndex; bar < bh.Count; bar++) { // Check for new 1-year high if (Math.Abs(high[bar] - HH1yr[bar]) < 0.0001) { _52WeekNH[bar] += 1; // On last bar (only) analyze NewHi for GICS info if (bar == lastBar) { AnalyzeNewHighGICS(sym); } } // Check for new 1-year low if (Math.Abs(low[bar] - LL1yr[bar]) < 0.0001) { _52WeekNL[bar] += 1; // On last bar (only) analyze NewLo for GICS info if (bar == lastBar) { AnalyzeNewLowGICS(sym); } } } } } catch (Exception e) { // Log any exceptions that occur during processing WLHost.Instance.AddLogItem("GlobalExec", sym + " " + e.Message, WLColor.Red); } } /// <summary> /// Analyzes GICS information for a symbol making a new high. /// </summary> private void AnalyzeNewHighGICS(string sym) { var _gics = Metadata.ClassificationAtLevel(sym, "GICS", 1); if (!string.IsNullOrEmpty(_gics)) { // Retrieve sector, industry group, industry, and subindustry info var sctr = Metadata.CorrespondingIndustryIndex(sym, "$SP1500", 1, "PR"); var sector_name = Metadata.ClassificationDescriptionAtLevel(sym, "GICS", 1); var igrp = Metadata.CorrespondingIndustryIndex(sym, "$SP1500", 2, "PR"); var industrygroup_name = Metadata.ClassificationDescriptionAtLevel(sym, "GICS", 2); var indu = Metadata.CorrespondingIndustryIndex(sym, "$SP1500", 3, "PR"); var industry_name = Metadata.ClassificationDescriptionAtLevel(sym, "GICS", 3); var sind = Metadata.CorrespondingIndustryIndex(sym, "$SP1500", 4, "PR"); var subindustry_name = Metadata.ClassificationDescriptionAtLevel(sym, "GICS", 4); // Add symbol to the appropriate GICS holder lists AddToGicsHolderList(NewHiSctrList, sctr, sector_name, sym); AddToGicsHolderList(NewHiIGrpList, igrp, industrygroup_name, sym); AddToGicsHolderList(NewHiInduList, indu, industry_name, sym); AddToGicsHolderList(NewHiSIndList, sind, subindustry_name, sym); } } /// <summary> /// Analyzes GICS information for a symbol making a new low. /// </summary> private void AnalyzeNewLowGICS(string sym) { var _gics = Metadata.ClassificationAtLevel(sym, "GICS", 1); if (!string.IsNullOrEmpty(_gics)) { // Retrieve sector, industry group, industry, and subindustry info var sctr = Metadata.CorrespondingIndustryIndex(sym, "$SP1500", 1, "PR"); var sector_name = Metadata.ClassificationDescriptionAtLevel(sym, "GICS", 1); var igrp = Metadata.CorrespondingIndustryIndex(sym, "$SP1500", 2, "PR"); var industrygroup_name = Metadata.ClassificationDescriptionAtLevel(sym, "GICS", 2); var indu = Metadata.CorrespondingIndustryIndex(sym, "$SP1500", 3, "PR"); var industry_name = Metadata.ClassificationDescriptionAtLevel(sym, "GICS", 3); var sind = Metadata.CorrespondingIndustryIndex(sym, "$SP1500", 4, "PR"); var subindustry_name = Metadata.ClassificationDescriptionAtLevel(sym, "GICS", 4); // Add symbol to the appropriate GICS holder lists AddToGicsHolderList(NewLoSctrList, sctr, sector_name, sym); AddToGicsHolderList(NewLoIGrpList, igrp, industrygroup_name, sym); AddToGicsHolderList(NewLoInduList, indu, industry_name, sym); AddToGicsHolderList(NewLoSIndList, sind, subindustry_name, sym); } } /// <summary> /// Adds a symbol to the appropriate gicsHolder list, creating a new holder if necessary. /// </summary> private void AddToGicsHolderList(List<gicsHolder> list, string gics, string gicsDescription, string sym) { // Find existing holder for this GICS code var holder = list.Find(gh1 => gh1.gics == gics); if (holder != null) { holder.gicsList.Add(sym); } else { // Create new holder if not found list.Add(new gicsHolder { gics = gics, gicsDescription = gicsDescription, gicsList = [sym] }); } } /// <summary> /// Handles plotting logic for the strategy. /// </summary> private void PlotAll() { foreach (var strategyInstance in StrategyInstances.Values) { // Synchronize the global _52WeekNH and _52WeekNL series to the current symbol's BarHistory. // This ensures the time series aligns with the bars of the symbol being plotted, // so that the plot displays correctly even if the symbol has missing or different dates. var _52NHSynch = TimeSeriesSynchronizer.Synchronize(_52WeekNH, strategyInstance.CurrentBars); var _52NLSynch = TimeSeriesSynchronizer.Synchronize(_52WeekNL, strategyInstance.CurrentBars); // Plot 1yr New Highs in its own pane strategyInstance.SetPaneDrawingOptions("pNH", 13, 35); strategyInstance.PlotTimeSeriesLine(_52NHSynch, _52WeekNH.Description, "pNH", WLColor.LawnGreen, 1); // Plot 1yr New Lows in its own pane strategyInstance.SetPaneDrawingOptions("pNL", 13, 40); strategyInstance.PlotTimeSeriesLine(_52NLSynch, _52WeekNL.Description, "pNL", WLColor.OrangeRed, 1); // The difference series is also synchronized to the current symbol's bars for correct plotting. var _52WeekHminusL = _52NHSynch - _52NLSynch; _52WeekHminusL.Description = "1yr New Highs - 1yr New Lows"; strategyInstance.SetPaneDrawingOptions("pHL", 15, 25); strategyInstance.PlotTimeSeries(_52WeekHminusL, _52WeekHminusL.Description, "pHL", WLColor.Blue, PlotStyle.ThickHistogram); } } /// <summary> /// Outputs sector and industry group information for new highs and new lows. /// </summary> private void PrintSectorAndIndustryOutputs() { // New Highs - Sector info var sectorNewHi = OutputSortedListToList.GenerateOutput(this, "New Highs, by Sector", NewHiSctrList); foreach (var line in sectorNewHi) { WriteToDebugLog(line); } // New Highs - Industry Group info var indGrpNewHi = OutputSortedListToList.GenerateOutput(this, "New Highs, by Industry Group", NewHiIGrpList); foreach (var line in indGrpNewHi) { WriteToDebugLog(line); } // New Lows - Sector info var sectorNewLo = OutputSortedListToList.GenerateOutput(this, "New Lows, by Sector", NewLoSctrList); foreach (var line in sectorNewLo) { WriteToDebugLog(line); } // New Lows - Industry Group info var indGrpNewLo = OutputSortedListToList.GenerateOutput(this, "New Lows, by Industry Group", NewLoIGrpList); foreach (var line in indGrpNewLo) { WriteToDebugLog(line); } // Add more printouts, as needed } } //============================================================ /// <summary> /// Holds GICS classification and associated symbols. /// </summary> public class gicsHolder { public string gics; public string gicsDescription; public List<string> gicsList = []; } /// <summary> /// Utility class for generating formatted output from GICS holder lists. /// </summary> public static class OutputSortedListToList { /// <summary> /// Generates a formatted list of strings for output, sorted by GICS code. /// </summary> public static List<string> GenerateOutput(UserStrategyBase obj, string Header, List<gicsHolder> List) { var outputList = new List<string>(); if (List.Count > 0) { //obj.WriteToDebugLog("Generating output for " + Header); var sortedList = List.OrderBy(h => h.gics).ToList(); var gicsWidth = Math.Max("GICS".Length, List.Max(h => h.gics?.Length ?? 0)) + 2; var descWidth = Math.Max("Description".Length, List.Max(h => h.gicsDescription?.Length ?? 0)) + 2; var symbolWidth = Math.Max("Symbol".Length, List.SelectMany(h => h.gicsList).DefaultIfEmpty("").Max(s => s?.Length ?? 0)) + 2; outputList.Add(""); outputList.Add("// " + Header); outputList.Add( $"{"GICS".PadRight(gicsWidth)}{"Description".PadRight(descWidth)}{"Symbol".PadRight(symbolWidth)}"); outputList.Add($"{new string('-', gicsWidth)}{new string('-', descWidth)}{new string('-', symbolWidth)}"); foreach (var holder in sortedList) { foreach (var symbol in holder.gicsList) { outputList.Add( $"{holder.gics.PadRight(gicsWidth)}" + $"{holder.gicsDescription.PadRight(descWidth)}" + $"{symbol.PadRight(symbolWidth)}" ); } outputList.Add(""); } } return outputList; } } /// <summary> /// Proxy stub for the Norgate Metadata class, which provides fundamental and classification information for equities. /// This stub returns placeholder values for demonstration and testing purposes. /// </summary> public static class Metadata { // Returns a classification code at a given level for a symbol (e.g., GICS sector, industry, etc.) public static string ClassificationAtLevel(string symbol, string classificationType, int level) => // Stub: return a placeholder string based on inputs $"{classificationType}_L{level}_{symbol}"; // Returns a description for a classification at a given level for a symbol public static string ClassificationDescriptionAtLevel(string symbol, string classificationType, int level) => // Stub: return a placeholder description $"{classificationType} Description L{level} for {symbol}"; // Returns the corresponding industry index for a symbol at a given level public static string CorrespondingIndustryIndex(string symbol, string indexName, int level, string type) => // Stub: return a placeholder industry index $"{indexName}_L{level}_{type}_{symbol}"; } }
The new code is even faster than the previous (already fast) code!
To illustrate, here are the times it took for me to scan the SP500 dataset, Daily scale:
My old old version: Eternity.
Previous version (non-AI): 23 secs.
Latest (AI-assisted) version: 8 secs.
I'll tweak it as needed (e.g. GICS output needs some work)... no worries.
Once AI engines know the programming language they can be very useful.
If not... watch out! lol
Thanks again!!
Sammy, I noticed the GICS calls were kind of spread throughout the code and perhaps a bit redundant. So, I asked Copilot to take a shot at consolidation of that code. It did! It created class GicsInfo, with method FromSymbol(string sym) and then adjusted the code to utilize the new class and method. Hence, the code below encapsulates the Gics data and operations into a new class. What amazed me is that it took Copilot about 10 seconds to make the changes and they were correct. (Also, code below still has the Metadata proxy, so remove it and uncomment the using.)
CODE:
using System; using System.Collections.Generic; using System.Linq; using WealthLab.Backtest; using WealthLab.Core; using WealthLab.Indicators; //using WealthLab.Norgate; // ReSharper disable InconsistentNaming namespace WealthScript6 { /// <summary> /// GlobalExec demonstrates a pattern for sharing and aggregating per-symbol strategy data /// across all symbols in a Wealth-Lab backtest. /// An instance of GlobalExec is created for each symbol in the dataset. /// Each instance operates independently for its assigned symbol and registers itself in a static /// ConcurrentDictionary keyed by symbol. This allows the BacktestComplete method, which is called once after /// all symbols have been processed, to access all strategy instances and their calculated indicator values. /// This scheme enables global analysis or reporting that requires access to per-symbol results, such as /// aggregating indicator values, cross-symbol comparisons, or custom portfolio-level logic. /// </summary> public class GlobalExec : UserStrategyBase { // Static dictionary to hold a reference to each GlobalExec instance, keyed by symbol. // This enables access to all per-symbol strategy instances and their calculated values from static/global // methods such as BacktestComplete. It is cleared at the start of each backtest to avoid stale data. private static readonly Dictionary<string, GlobalExec> StrategyInstances = new(); // TimeSeries for tracking new highs, new lows private static TimeSeries _52WeekNH, _52WeekNL; // Static flag to ensure _52WeekNH and _52WeekNL are only initialized once per run private static bool _globalSeriesInitialized; // Lists to hold GICS information for new highs and new lows (static: shared across all symbols) private static readonly List<gicsHolder> NewHiIGrpList = []; private static readonly List<gicsHolder> NewHiInduList = []; private static readonly List<gicsHolder> NewHiSctrList = []; private static readonly List<gicsHolder> NewHiSIndList = []; private static readonly List<gicsHolder> NewLoIGrpList = []; private static readonly List<gicsHolder> NewLoInduList = []; private static readonly List<gicsHolder> NewLoSctrList = []; private static readonly List<gicsHolder> NewLoSIndList = []; // DataSet and related info private DataSet ds; private string dsName; private int oneYr; // Initialize is called once per symbol instance public override void Initialize(BarHistory bars) { // Register this instance for the current symbol StrategyInstances[bars.Symbol] = this; // Output the current thread id for debugging //WriteToDebugLog($"Initialize called on Thread ID: {Thread.CurrentThread.ManagedThreadId}"); // Ensure _52WeekNH and _52WeekNL are only initialized once per run, using the first symbol's bars // Locking is not necessary because Wealth-Lab 8 does not use multiple threads when running a strategy // (Strategy optimization may be done in parallel, but it is unlikely this strategy would ever be optimized.) if (!_globalSeriesInitialized) { _52WeekNH = new TimeSeries(bars.DateTimes, 0) {Description = "1yr New Highs (" + bars.Scale + ")"}; _52WeekNL = new TimeSeries(bars.DateTimes, 0) {Description = "1yr New Lows (" + bars.Scale + ")"}; _globalSeriesInitialized = true; } // Set up chart pane and display options SetPaneDrawingOptions("Price", 100); var cds = new ChartDisplaySettings { ShowVolumePane = false, // Hide volume pane PaneSeparatorWidth = 0 // Hide pane separator lines }; SetChartDrawingOptions(cds); // Apply chart settings // Plot GICS info of clicked symbol in Price Pane var symbol = bars.Symbol; var tab = '\t'; // Retrieve GICS metadata for the symbol using encapsulated method var gicsInfo = GicsInfo.FromSymbol(symbol); if (gicsInfo != null) { // Display GICS hierarchy in the chart header DrawHeaderText(symbol + ": " + tab + gicsInfo.SectorName + " (" + gicsInfo.Sector + ") \\ ", WLColor.Aqua, 12); DrawHeaderText(tab + " " + gicsInfo.IndustryGroupName + " (" + gicsInfo.IndustryGroup + ") \\ ", WLColor.MediumAquamarine, 12); DrawHeaderText(tab + " " + gicsInfo.IndustryName + " (" + gicsInfo.Industry + ") \\ ", WLColor.SlateBlue, 12); DrawHeaderText(tab + " " + gicsInfo.SubIndustryName + " (" + gicsInfo.SubIndustry + ") ", WLColor.OliveDrab, 12); } else { DrawHeaderText(symbol + ": No GICS info available", WLColor.Red, 12); } DrawHeaderText(" "); //---------- // Determine the number of bars in one year based on the chart scale if (bars.Scale == HistoryScale.Daily) { oneYr = 252; } else if (bars.Scale == HistoryScale.Weekly) { oneYr = 52; } else if (bars.Scale == HistoryScale.Monthly) { oneYr = 12; } else { DrawHeaderText("Change Scale to Daily, Weekly or Monthly", WLColor.Fuchsia, 24); return; } // Set the start index for calculations StartIndex = oneYr + 1; DrawHeaderText(" "); dsName = ExecutionDataSetName; if (dsName == null) { DrawHeaderText("Single Symbol: " + bars.Symbol, WLColor.LightGray, 12); return; } ds = WLHost.Instance.FindDataSet(dsName); DrawHeaderText("DataSet: " + dsName, WLColor.Tan, 15); DrawHeaderText("# of Symbols in Dataset = " + ds.Symbols.Count, WLColor.Tan, 13); // WriteToDebugLog("DataSet: " + dsName); // WriteToDebugLog("# of Symbols in Dataset = " + ds.Symbols.Count); // Abort if it's not a Norgate dataset, Norgate provides GICS info for its own symbols only //if (!dsName.Contains("Norgate")) //{ //DrawHeaderText("Strategy terminated as it only works with Norgate datasets!", WLColor.NeonFuschia, 15); //return; //} ProcessSymbol(bars); } // No per-bar logic in this strategy public override void Execute(BarHistory bars, int idx) { } // Called once at the start of the backtest public override void BacktestBegin() { // Clear StrategyInstances at the start of each backtest to avoid stale data StrategyInstances.Clear(); // Reset and re-initialize the static TimeSeries and flag for each run _globalSeriesInitialized = false; _52WeekNH = null; _52WeekNL = null; // Clear all static GICS lists at the start of each run NewHiIGrpList.Clear(); NewHiInduList.Clear(); NewHiSctrList.Clear(); NewHiSIndList.Clear(); NewLoIGrpList.Clear(); NewLoInduList.Clear(); NewLoSctrList.Clear(); NewLoSIndList.Clear(); } // Called once after all symbols have been processed public override void BacktestComplete() { // Plot the synchronized time series for each symbol PlotAll(); PrintSectorAndIndustryOutputs(); } /// <summary> /// Processes a single symbol's data for new highs/lows and GICS analysis. /// </summary> private void ProcessSymbol(BarHistory bars) { var sym = bars.Symbol; try { WriteToStatusBar("Processing " + sym); // Update status bar var bh = GetHistory(bars, sym); // Synched with plotted symbol's bars var high = bh.High; var low = bh.Low; var firstValidBar = high.FirstValidIndex; var lastBar = bh.Count - 1; if (bh.Count >= firstValidBar + StartIndex) // Symbol has enough data { TimeSeries HH1yr = Highest.Series(high, oneYr); TimeSeries LL1yr = Lowest.Series(low, oneYr); for (var bar = firstValidBar + StartIndex; bar < bh.Count; bar++) { // Check for new 1-year high if (Math.Abs(high[bar] - HH1yr[bar]) < 0.0001) { _52WeekNH[bar] += 1; // On last bar (only) analyze NewHi for GICS info if (bar == lastBar) { AnalyzeNewHighGICS(sym); } } // Check for new 1-year low if (Math.Abs(low[bar] - LL1yr[bar]) < 0.0001) { _52WeekNL[bar] += 1; // On last bar (only) analyze NewLo for GICS info if (bar == lastBar) { AnalyzeNewLowGICS(sym); } } } } } catch (Exception e) { // Log any exceptions that occur during processing WLHost.Instance.AddLogItem("GlobalExec", sym + " " + e.Message, WLColor.Red); } } /// <summary> /// Analyzes GICS information for a symbol making a new high. /// </summary> private void AnalyzeNewHighGICS(string sym) { var gicsInfo = GicsInfo.FromSymbol(sym); if (gicsInfo != null) { AddToGicsHolderList(NewHiSctrList, gicsInfo.Sector, gicsInfo.SectorName, sym); AddToGicsHolderList(NewHiIGrpList, gicsInfo.IndustryGroup, gicsInfo.IndustryGroupName, sym); AddToGicsHolderList(NewHiInduList, gicsInfo.Industry, gicsInfo.IndustryName, sym); AddToGicsHolderList(NewHiSIndList, gicsInfo.SubIndustry, gicsInfo.SubIndustryName, sym); } } /// <summary> /// Analyzes GICS information for a symbol making a new low. /// </summary> private void AnalyzeNewLowGICS(string sym) { var gicsInfo = GicsInfo.FromSymbol(sym); if (gicsInfo != null) { AddToGicsHolderList(NewLoSctrList, gicsInfo.Sector, gicsInfo.SectorName, sym); AddToGicsHolderList(NewLoIGrpList, gicsInfo.IndustryGroup, gicsInfo.IndustryGroupName, sym); AddToGicsHolderList(NewLoInduList, gicsInfo.Industry, gicsInfo.IndustryName, sym); AddToGicsHolderList(NewLoSIndList, gicsInfo.SubIndustry, gicsInfo.SubIndustryName, sym); } } /// <summary> /// Holds all GICS metadata for a symbol and encapsulates retrieval logic. /// </summary> private class GicsInfo { public string Sector; public string SectorName; public string IndustryGroup; public string IndustryGroupName; public string Industry; public string IndustryName; public string SubIndustry; public string SubIndustryName; /// <summary> /// Factory method to retrieve all GICS metadata for a symbol in a single call. /// </summary> public static GicsInfo FromSymbol(string sym) { var gics = Metadata.ClassificationAtLevel(sym, "GICS", 1); if (string.IsNullOrEmpty(gics)) return null; return new GicsInfo { Sector = Metadata.CorrespondingIndustryIndex(sym, "$SP1500", 1, "PR"), SectorName = Metadata.ClassificationDescriptionAtLevel(sym, "GICS", 1), IndustryGroup = Metadata.CorrespondingIndustryIndex(sym, "$SP1500", 2, "PR"), IndustryGroupName = Metadata.ClassificationDescriptionAtLevel(sym, "GICS", 2), Industry = Metadata.CorrespondingIndustryIndex(sym, "$SP1500", 3, "PR"), IndustryName = Metadata.ClassificationDescriptionAtLevel(sym, "GICS", 3), SubIndustry = Metadata.CorrespondingIndustryIndex(sym, "$SP1500", 4, "PR"), SubIndustryName = Metadata.ClassificationDescriptionAtLevel(sym, "GICS", 4) }; } } /// <summary> /// Adds a symbol to the appropriate gicsHolder list, creating a new holder if necessary. /// </summary> private void AddToGicsHolderList(List<gicsHolder> list, string gics, string gicsDescription, string sym) { // Find existing holder for this GICS code var holder = list.Find(gh1 => gh1.gics == gics); if (holder != null) { holder.gicsList.Add(sym); } else { // Create new holder if not found list.Add(new gicsHolder { gics = gics, gicsDescription = gicsDescription, gicsList = [sym] }); } } /// <summary> /// Handles plotting logic for the strategy. /// </summary> private void PlotAll() { foreach (var strategyInstance in StrategyInstances.Values) { // Synchronize the global _52WeekNH and _52WeekNL series to the current symbol's BarHistory. // This ensures the time series aligns with the bars of the symbol being plotted, // so that the plot displays correctly even if the symbol has missing or different dates. var _52NHSynch = TimeSeriesSynchronizer.Synchronize(_52WeekNH, strategyInstance.CurrentBars); var _52NLSynch = TimeSeriesSynchronizer.Synchronize(_52WeekNL, strategyInstance.CurrentBars); // Plot 1yr New Highs in its own pane strategyInstance.SetPaneDrawingOptions("pNH", 13, 35); strategyInstance.PlotTimeSeriesLine(_52NHSynch, _52WeekNH.Description, "pNH", WLColor.LawnGreen, 1); // Plot 1yr New Lows in its own pane strategyInstance.SetPaneDrawingOptions("pNL", 13, 40); strategyInstance.PlotTimeSeriesLine(_52NLSynch, _52WeekNL.Description, "pNL", WLColor.OrangeRed, 1); // The difference series is also synchronized to the current symbol's bars for correct plotting. var _52WeekHminusL = _52NHSynch - _52NLSynch; _52WeekHminusL.Description = "1yr New Highs - 1yr New Lows"; strategyInstance.SetPaneDrawingOptions("pHL", 15, 25); strategyInstance.PlotTimeSeries(_52WeekHminusL, _52WeekHminusL.Description, "pHL", WLColor.Blue, PlotStyle.ThickHistogram); } } /// <summary> /// Outputs sector and industry group information for new highs and new lows. /// </summary> private void PrintSectorAndIndustryOutputs() { // New Highs - Sector info var sectorNewHi = OutputSortedListToList.GenerateOutput(this, "New Highs, by Sector", NewHiSctrList); foreach (var line in sectorNewHi) { WriteToDebugLog(line); } // New Highs - Industry Group info var indGrpNewHi = OutputSortedListToList.GenerateOutput(this, "New Highs, by Industry Group", NewHiIGrpList); foreach (var line in indGrpNewHi) { WriteToDebugLog(line); } // New Lows - Sector info var sectorNewLo = OutputSortedListToList.GenerateOutput(this, "New Lows, by Sector", NewLoSctrList); foreach (var line in sectorNewLo) { WriteToDebugLog(line); } // New Lows - Industry Group info var indGrpNewLo = OutputSortedListToList.GenerateOutput(this, "New Lows, by Industry Group", NewLoIGrpList); foreach (var line in indGrpNewLo) { WriteToDebugLog(line); } // Add more printouts, as needed } } //============================================================ /// <summary> /// Holds GICS classification and associated symbols. /// </summary> public class gicsHolder { public string gics; public string gicsDescription; public List<string> gicsList = []; } /// <summary> /// Utility class for generating formatted output from GICS holder lists. /// </summary> public static class OutputSortedListToList { /// <summary> /// Generates a formatted list of strings for output, sorted by GICS code. /// </summary> public static List<string> GenerateOutput(UserStrategyBase obj, string Header, List<gicsHolder> List) { var outputList = new List<string>(); if (List.Count > 0) { //obj.WriteToDebugLog("Generating output for " + Header); var sortedList = List.OrderBy(h => h.gics).ToList(); var gicsWidth = Math.Max("GICS".Length, List.Max(h => h.gics?.Length ?? 0)) + 2; var descWidth = Math.Max("Description".Length, List.Max(h => h.gicsDescription?.Length ?? 0)) + 2; var symbolWidth = Math.Max("Symbol".Length, List.SelectMany(h => h.gicsList).DefaultIfEmpty("").Max(s => s?.Length ?? 0)) + 2; outputList.Add(""); outputList.Add("// " + Header); outputList.Add( $"{"GICS".PadRight(gicsWidth)}{"Description".PadRight(descWidth)}{"Symbol".PadRight(symbolWidth)}"); outputList.Add($"{new string('-', gicsWidth)}{new string('-', descWidth)}{new string('-', symbolWidth)}"); foreach (var holder in sortedList) { foreach (var symbol in holder.gicsList) { outputList.Add( $"{holder.gics.PadRight(gicsWidth)}" + $"{holder.gicsDescription.PadRight(descWidth)}" + $"{symbol.PadRight(symbolWidth)}" ); } outputList.Add(""); } } return outputList; } } /// <summary> /// Proxy stub for the Norgate Metadata class, which provides fundamental and classification information for equities. /// This stub returns placeholder values for demonstration and testing purposes. /// </summary> public static class Metadata { // Returns a classification code at a given level for a symbol (e.g., GICS sector, industry, etc.) public static string ClassificationAtLevel(string symbol, string classificationType, int level) => // Stub: return a placeholder string based on inputs $"{classificationType}_L{level}_{symbol}"; // Returns a description for a classification at a given level for a symbol public static string ClassificationDescriptionAtLevel(string symbol, string classificationType, int level) => // Stub: return a placeholder description $"{classificationType} Description L{level} for {symbol}"; // Returns the corresponding industry index for a symbol at a given level public static string CorrespondingIndustryIndex(string symbol, string indexName, int level, string type) => // Stub: return a placeholder industry index $"{indexName}_L{level}_{type}_{symbol}"; } }
I'm going to flag the AI-assisted versions as unreliable, for now.
They give different values for 1yr new highs/lows than the pre-AI version, and also print a different number of symbols to debug than the (often incorrect) value they show in chart window.
Don't know where the problem is... it may be with the use of 'static' property which can be tricky if you're changing Scale, etc.
----------------------------
For now, the [u]gold standard/u] version is the pre-AI version: Post #6, as modified in Post #9.
Did you forget to remove my Metadata proxy class? If so, that might be an issue. In any case, when I have a few minutes I'll run some more tests.
Edit: the Metadata proxy class wouldn't impact the counting. Scrap that idea.
Edit: the Metadata proxy class wouldn't impact the counting. Scrap that idea.
The problem had to do with date synchronization. So the fix is:
1) In Initialize(), the code now calls CreateCounterSeries(). Therein, for one time only, find the "widest" data range of all the symbols in the dataset. Create the _52WeekNH and _52WeekNL time series using the widest date times.
2) In ProcessSymbol() get a bar history synchronized with master time series _52WeekNH, because _52WeekNH is the widest date range. That way all symbols will always use a bar history synchronized to the counters.
It runs a tad slower. Also, I put in a few other minor fixes dealing with runs of a single symbol. And, I doubled checked the code in BacktestBegin. The correct static initializations are being done. The strange results you were getting were due to the above error dealing with synchronization.
CODE:
using System; using System.Collections.Generic; using System.Linq; using WealthLab.Backtest; using WealthLab.Core; using WealthLab.Data; using WealthLab.Indicators; //using WealthLab.Norgate; // ReSharper disable InconsistentNaming namespace WealthScript6 { /// <summary> /// GlobalExec demonstrates a pattern for sharing and aggregating per-symbol strategy data /// across all symbols in a Wealth-Lab backtest. /// An instance of GlobalExec is created for each symbol in the dataset. /// Each instance operates independently for its assigned symbol and registers itself in a static /// ConcurrentDictionary keyed by symbol. This allows the BacktestComplete method, which is called once after /// all symbols have been processed, to access all strategy instances and their calculated indicator values. /// This scheme enables global analysis or reporting that requires access to per-symbol results, such as /// aggregating indicator values, cross-symbol comparisons, or custom portfolio-level logic. /// </summary> public class GlobalExec : UserStrategyBase { // Static dictionary to hold a reference to each GlobalExec instance, keyed by symbol. // This enables access to all per-symbol strategy instances and their calculated values from static/global // methods such as BacktestComplete. It is cleared at the start of each backtest to avoid stale data. private static readonly Dictionary<string, GlobalExec> StrategyInstances = new(); // TimeSeries for tracking new highs, new lows private static TimeSeries _52WeekNH, _52WeekNL; // Static flag to ensure _52WeekNH and _52WeekNL are only initialized once per run private static bool _globalSeriesInitialized; // Lists to hold GICS information for new highs and new lows (static: shared across all symbols) private static readonly List<gicsHolder> NewHiIGrpList = []; private static readonly List<gicsHolder> NewHiInduList = []; private static readonly List<gicsHolder> NewHiSctrList = []; private static readonly List<gicsHolder> NewHiSIndList = []; private static readonly List<gicsHolder> NewLoIGrpList = []; private static readonly List<gicsHolder> NewLoInduList = []; private static readonly List<gicsHolder> NewLoSctrList = []; private static readonly List<gicsHolder> NewLoSIndList = []; // DataSet and related info private DataSet ds; private string dsName; private int oneYr; private static bool _inErrorState = false; // Initialize is called once per symbol instance public override void Initialize(BarHistory bars) { if (_inErrorState) { return; } // Register this instance for the current symbol StrategyInstances[bars.Symbol] = this; // Output the current thread id for debugging //WriteToDebugLog($"Initialize called on Thread ID: {Thread.CurrentThread.ManagedThreadId}"); // Set up chart pane and display options SetPaneDrawingOptions("Price", 100); var cds = new ChartDisplaySettings { ShowVolumePane = false, // Hide volume pane PaneSeparatorWidth = 0 // Hide pane separator lines }; SetChartDrawingOptions(cds); // Apply chart settings // Plot GICS info of clicked symbol in Price Pane var symbol = bars.Symbol; var tab = '\t'; // Retrieve GICS metadata for the symbol using encapsulated method var gicsInfo = GicsInfo.FromSymbol(symbol); if (gicsInfo != null) { // Display GICS hierarchy in the chart header DrawHeaderText(symbol + ": " + tab + gicsInfo.SectorName + " (" + gicsInfo.Sector + ") \\ ", WLColor.Aqua, 12); DrawHeaderText(tab + " " + gicsInfo.IndustryGroupName + " (" + gicsInfo.IndustryGroup + ") \\ ", WLColor.MediumAquamarine, 12); DrawHeaderText(tab + " " + gicsInfo.IndustryName + " (" + gicsInfo.Industry + ") \\ ", WLColor.SlateBlue, 12); DrawHeaderText(tab + " " + gicsInfo.SubIndustryName + " (" + gicsInfo.SubIndustry + ") ", WLColor.OliveDrab, 12); } else { DrawHeaderText(symbol + ": No GICS info available", WLColor.Red, 12); } DrawHeaderText(" "); //---------- // Determine the number of bars in one year based on the chart scale if (bars.Scale == HistoryScale.Daily) { oneYr = 252; } else if (bars.Scale == HistoryScale.Weekly) { oneYr = 52; } else if (bars.Scale == HistoryScale.Monthly) { oneYr = 12; } else { _inErrorState = true; WriteToDebugLog("Change Scale to Daily, Weekly or Monthly", false); return; } // Set the start index for calculations StartIndex = oneYr + 1; DrawHeaderText(" "); dsName = ExecutionDataSetName; if (string.IsNullOrWhiteSpace(dsName)) { DrawHeaderText("Single Symbol: " + bars.Symbol, WLColor.LightGray, 12); } else { ds = WLHost.Instance.FindDataSet(dsName); DrawHeaderText("DataSet: " + dsName, WLColor.Tan, 15); DrawHeaderText("# of Symbols in Dataset = " + ds.Symbols.Count, WLColor.Tan, 13); } // Abort if it's not a Norgate dataset, Norgate provides GICS info for its own symbols only //if (!dsName.Contains("Norgate")) //{ //DrawHeaderText("Strategy terminated as it only works with Norgate datasets!", WLColor.NeonFuschia, 15); //return; //} if (!_globalSeriesInitialized) { CreateCounterSeries(bars); } ProcessSymbol(bars); } private void CreateCounterSeries(BarHistory bars) { // --- Find the symbol with the most data and use its DateTimes for the static series --- if (!_globalSeriesInitialized) { if (ds == null) { _52WeekNH = new TimeSeries(bars.DateTimes, 0) { Description = "1yr New Highs (" + bars.Scale + ")" }; _52WeekNL = new TimeSeries(bars.DateTimes, 0) { Description = "1yr New Lows (" + bars.Scale + ")" }; _globalSeriesInitialized = true; } else { var maxCount = 0; BarHistory maxBars = null; foreach (var sym in ds.Symbols) { var bh = WLHost.Instance.GetHistory(sym, bars.Scale, DateTime.MinValue, DateTime.MaxValue, 999999, new DataRequestOptions(ds)); if (bh != null && bh.Count > maxCount) { maxCount = bh.Count; maxBars = bh; } } if (maxBars != null) { _52WeekNH = new TimeSeries(maxBars.DateTimes, 0) { Description = "1yr New Highs (" + bars.Scale + ")" }; _52WeekNL = new TimeSeries(maxBars.DateTimes, 0) { Description = "1yr New Lows (" + bars.Scale + ")" }; _globalSeriesInitialized = true; } } } } // No per-bar logic in this strategy public override void Execute(BarHistory bars, int idx) { } // Called once at the start of the backtest public override void BacktestBegin() { _inErrorState = false; // Reset error state for each backtest // Clear StrategyInstances at the start of each backtest to avoid stale data StrategyInstances.Clear(); // Reset and re-initialize the static TimeSeries and flag for each run _globalSeriesInitialized = false; _52WeekNH = null; _52WeekNL = null; // Clear all static GICS lists at the start of each run NewHiIGrpList.Clear(); NewHiInduList.Clear(); NewHiSctrList.Clear(); NewHiSIndList.Clear(); NewLoIGrpList.Clear(); NewLoInduList.Clear(); NewLoSctrList.Clear(); NewLoSIndList.Clear(); } // Called once after all symbols have been processed public override void BacktestComplete() { if (_inErrorState) { return; } // Plot the synchronized time series for each symbol PlotAll(); PrintSectorAndIndustryOutputs(); } /// <summary> /// Processes a single symbol's data for new highs/lows and GICS analysis. /// </summary> private void ProcessSymbol(BarHistory bars) { var sym = bars.Symbol; try { WriteToStatusBar("Processing " + sym); // Update status bar // Synchronize the current bars to the global _52WeekNH time series so that the // bars align with the time series. The time series is static and shared across all symbols. // _52WeekNH and _52WeekNL are where the counting is done. // Note that _52WeekNH and _52WeekNL have the same dates, and have the widest date range // of all symbols in the dataset. var bh = BarHistorySynchronizer.Synchronize(bars, _52WeekNH); var high = bh.High; var low = bh.Low; var firstValidBar = high.FirstValidIndex; var lastBar = bh.Count - 1; if (bh.Count >= firstValidBar + StartIndex) // Symbol has enough data { TimeSeries HH1yr = Highest.Series(high, oneYr); TimeSeries LL1yr = Lowest.Series(low, oneYr); for (var bar = firstValidBar + StartIndex; bar < bh.Count; bar++) { // Check for new 1-year high if (Math.Abs(high[bar] - HH1yr[bar]) < 0.0001) { _52WeekNH[bar] += 1; // On last bar (only) analyze NewHi for GICS info if (bar == lastBar) { AnalyzeNewHighGICS(sym); } } // Check for new 1-year low if (Math.Abs(low[bar] - LL1yr[bar]) < 0.0001) { _52WeekNL[bar] += 1; // On last bar (only) analyze NewLo for GICS info if (bar == lastBar) { AnalyzeNewLowGICS(sym); } } } } } catch (Exception e) { // Log any exceptions that occur during processing WLHost.Instance.AddLogItem("GlobalExec", sym + " " + e.Message, WLColor.Red); } } /// <summary> /// Analyzes GICS information for a symbol making a new high. /// </summary> private void AnalyzeNewHighGICS(string sym) { var gicsInfo = GicsInfo.FromSymbol(sym); if (gicsInfo != null) { AddToGicsHolderList(NewHiSctrList, gicsInfo.Sector, gicsInfo.SectorName, sym); AddToGicsHolderList(NewHiIGrpList, gicsInfo.IndustryGroup, gicsInfo.IndustryGroupName, sym); AddToGicsHolderList(NewHiInduList, gicsInfo.Industry, gicsInfo.IndustryName, sym); AddToGicsHolderList(NewHiSIndList, gicsInfo.SubIndustry, gicsInfo.SubIndustryName, sym); } } /// <summary> /// Analyzes GICS information for a symbol making a new low. /// </summary> private void AnalyzeNewLowGICS(string sym) { var gicsInfo = GicsInfo.FromSymbol(sym); if (gicsInfo != null) { AddToGicsHolderList(NewLoSctrList, gicsInfo.Sector, gicsInfo.SectorName, sym); AddToGicsHolderList(NewLoIGrpList, gicsInfo.IndustryGroup, gicsInfo.IndustryGroupName, sym); AddToGicsHolderList(NewLoInduList, gicsInfo.Industry, gicsInfo.IndustryName, sym); AddToGicsHolderList(NewLoSIndList, gicsInfo.SubIndustry, gicsInfo.SubIndustryName, sym); } } /// <summary> /// Holds all GICS metadata for a symbol and encapsulates retrieval logic. /// </summary> private class GicsInfo { public string Sector; public string SectorName; public string IndustryGroup; public string IndustryGroupName; public string Industry; public string IndustryName; public string SubIndustry; public string SubIndustryName; /// <summary> /// Factory method to retrieve all GICS metadata for a symbol in a single call. /// </summary> public static GicsInfo FromSymbol(string sym) { var gics = Metadata.ClassificationAtLevel(sym, "GICS", 1); if (string.IsNullOrEmpty(gics)) return null; return new GicsInfo { Sector = Metadata.CorrespondingIndustryIndex(sym, "$SP1500", 1, "PR"), SectorName = Metadata.ClassificationDescriptionAtLevel(sym, "GICS", 1), IndustryGroup = Metadata.CorrespondingIndustryIndex(sym, "$SP1500", 2, "PR"), IndustryGroupName = Metadata.ClassificationDescriptionAtLevel(sym, "GICS", 2), Industry = Metadata.CorrespondingIndustryIndex(sym, "$SP1500", 3, "PR"), IndustryName = Metadata.ClassificationDescriptionAtLevel(sym, "GICS", 3), SubIndustry = Metadata.CorrespondingIndustryIndex(sym, "$SP1500", 4, "PR"), SubIndustryName = Metadata.ClassificationDescriptionAtLevel(sym, "GICS", 4) }; } } /// <summary> /// Adds a symbol to the appropriate gicsHolder list, creating a new holder if necessary. /// </summary> private void AddToGicsHolderList(List<gicsHolder> list, string gics, string gicsDescription, string sym) { // Find existing holder for this GICS code var holder = list.Find(gh1 => gh1.gics == gics); if (holder != null) { holder.gicsList.Add(sym); } else { // Create new holder if not found list.Add(new gicsHolder { gics = gics, gicsDescription = gicsDescription, gicsList = [sym] }); } } /// <summary> /// Handles plotting logic for the strategy. /// </summary> private void PlotAll() { foreach (var strategyInstance in StrategyInstances.Values) { // Synchronize the global _52WeekNH and _52WeekNL series to the current symbol's BarHistory. // This ensures the time series aligns with the bars of the symbol being plotted, // so that the plot displays correctly even if the symbol has missing or different dates. var _52NHSynch = TimeSeriesSynchronizer.Synchronize(_52WeekNH, strategyInstance.CurrentBars); var _52NLSynch = TimeSeriesSynchronizer.Synchronize(_52WeekNL, strategyInstance.CurrentBars); // Plot 1yr New Highs in its own pane strategyInstance.SetPaneDrawingOptions("pNH", 13, 35); strategyInstance.PlotTimeSeriesLine(_52NHSynch, _52WeekNH.Description, "pNH", WLColor.LawnGreen, 1); // Plot 1yr New Lows in its own pane strategyInstance.SetPaneDrawingOptions("pNL", 13, 40); strategyInstance.PlotTimeSeriesLine(_52NLSynch, _52WeekNL.Description, "pNL", WLColor.OrangeRed, 1); // The difference series is also synchronized to the current symbol's bars for correct plotting. var _52WeekHminusL = _52NHSynch - _52NLSynch; _52WeekHminusL.Description = "1yr New Highs - 1yr New Lows"; strategyInstance.SetPaneDrawingOptions("pHL", 15, 25); strategyInstance.PlotTimeSeries(_52WeekHminusL, _52WeekHminusL.Description, "pHL", WLColor.Blue, PlotStyle.ThickHistogram); } } /// <summary> /// Outputs sector and industry group information for new highs and new lows. /// </summary> private void PrintSectorAndIndustryOutputs() { // New Highs - Sector info var sectorNewHi = OutputSortedListToList.GenerateOutput(this, "New Highs, by Sector", NewHiSctrList); foreach (var line in sectorNewHi) { WriteToDebugLog(line); } // New Highs - Industry Group info var indGrpNewHi = OutputSortedListToList.GenerateOutput(this, "New Highs, by Industry Group", NewHiIGrpList); foreach (var line in indGrpNewHi) { WriteToDebugLog(line); } // New Lows - Sector info var sectorNewLo = OutputSortedListToList.GenerateOutput(this, "New Lows, by Sector", NewLoSctrList); foreach (var line in sectorNewLo) { WriteToDebugLog(line); } // New Lows - Industry Group info var indGrpNewLo = OutputSortedListToList.GenerateOutput(this, "New Lows, by Industry Group", NewLoIGrpList); foreach (var line in indGrpNewLo) { WriteToDebugLog(line); } // Add more printouts, as needed } } //============================================================ /// <summary> /// Holds GICS classification and associated symbols. /// </summary> public class gicsHolder { public string gics; public string gicsDescription; public List<string> gicsList = []; } /// <summary> /// Utility class for generating formatted output from GICS holder lists. /// </summary> public static class OutputSortedListToList { /// <summary> /// Generates a formatted list of strings for output, sorted by GICS code. /// </summary> public static List<string> GenerateOutput(UserStrategyBase obj, string Header, List<gicsHolder> List) { var outputList = new List<string>(); if (List.Count > 0) { //obj.WriteToDebugLog("Generating output for " + Header); var sortedList = List.OrderBy(h => h.gics).ToList(); var gicsWidth = Math.Max("GICS".Length, List.Max(h => h.gics?.Length ?? 0)) + 2; var descWidth = Math.Max("Description".Length, List.Max(h => h.gicsDescription?.Length ?? 0)) + 2; var symbolWidth = Math.Max("Symbol".Length, List.SelectMany(h => h.gicsList).DefaultIfEmpty("").Max(s => s?.Length ?? 0)) + 2; outputList.Add(""); outputList.Add("// " + Header); outputList.Add( $"{"GICS".PadRight(gicsWidth)}{"Description".PadRight(descWidth)}{"Symbol".PadRight(symbolWidth)}"); outputList.Add($"{new string('-', gicsWidth)}{new string('-', descWidth)}{new string('-', symbolWidth)}"); foreach (var holder in sortedList) { foreach (var symbol in holder.gicsList) { outputList.Add( $"{holder.gics.PadRight(gicsWidth)}" + $"{holder.gicsDescription.PadRight(descWidth)}" + $"{symbol.PadRight(symbolWidth)}" ); } outputList.Add(""); } } return outputList; } } /// <summary> /// Proxy stub for the Norgate Metadata class, which provides fundamental and classification information for equities. /// This stub returns placeholder values for demonstration and testing purposes. /// </summary> public static class Metadata { // Returns a classification code at a given level for a symbol (e.g., GICS sector, industry, etc.) public static string ClassificationAtLevel(string symbol, string classificationType, int level) => // Stub: return a placeholder string based on inputs $"{classificationType}_L{level}_{symbol}"; // Returns a description for a classification at a given level for a symbol public static string ClassificationDescriptionAtLevel(string symbol, string classificationType, int level) => // Stub: return a placeholder description $"{classificationType} Description L{level} for {symbol}"; // Returns the corresponding industry index for a symbol at a given level public static string CorrespondingIndustryIndex(string symbol, string indexName, int level, string type) => // Stub: return a placeholder industry index $"{indexName}_L{level}_{type}_{symbol}"; } }
It's working perfectly now.
Unless me/you/somebody discovers an issue this latest version can be crowned as The Champ! 🙌
Thanks for your effort - and persistence! 👍👍
I've marked the thread as solved.
Ciao.
Unless me/you/somebody discovers an issue this latest version can be crowned as The Champ! 🙌
Thanks for your effort - and persistence! 👍👍
I've marked the thread as solved.
Ciao.
Sammy, I didn't like using GetHistory() because of performance issues and depending on the distribution of dates there could be occasional issues. So, I thought why not just tally the counts in a couple of dictionaries as you go along, and then build the time series for charting at the end. This avoids GetHistory() and insures all dates of all symbols are represented. So, the new code is below. It runs faster. Also, you can call ProcessSymbol(bars) from Initialize or in BacktestComplete loop. It automatically detects if ProcessSymbo(bars) was called from Initialize() - see the code. You probably made some changes in the meantime, so if you decide to use this new more efficient code then hopefully those changes will easily integrate into the new code. (Side note: I told GitHub Copilot to generate the comment for the class - if you read it, I didn't write any of it - that's all AI generated from reading the code.)
CODE:
using System; using System.Collections.Generic; using System.Linq; using WealthLab.Backtest; using WealthLab.Core; using WealthLab.Indicators; //using WealthLab.Norgate; // ReSharper disable InconsistentNaming namespace WealthScript6 { /// <summary> /// The GlobalExec strategy demonstrates a pattern for cross-symbol data collection and aggregation /// in Wealth-Lab. For each symbol in the dataset, an instance of GlobalExec is created and processes its /// own BarHistory. Static fields and collections are used to accumulate results—such as new 52-week highs/lows /// and GICS classifications—across all symbols. These results are tallied efficiently using dictionaries keyed /// by date, ensuring every date in the dataset is accounted for. After all symbols have been processed, /// BacktestComplete performs global aggregation, reporting, and plotting using the accumulated data. /// This approach enables advanced cross-symbol analysis, sector/industry breakdowns, and custom portfolio-level /// logic that require access to the results of all symbols in the dataset, while minimizing redundant computation /// and memory usage. /// </summary> public class GlobalExec : UserStrategyBase { // Static dictionary to hold a reference to each GlobalExec instance, keyed by symbol. // This enables access to all per-symbol strategy instances and their calculated values from static/global // methods such as BacktestComplete. It is cleared at the start of each backtest to avoid stale data. private static readonly Dictionary<string, GlobalExec> StrategyInstances = new(); // TimeSeries for displaying new highs, new lows private static TimeSeries _52WeekNH, _52WeekNL; // Dictionaries to hold the count of new highs and lows for each date private static Dictionary<DateTime, int> _52WeekNHCount; private static Dictionary<DateTime, int> _52WeekNLCount; // Lists to hold GICS information for new highs and new lows (static: shared across all symbols) private static readonly List<gicsHolder> NewHiIGrpList = []; private static readonly List<gicsHolder> NewHiInduList = []; private static readonly List<gicsHolder> NewHiSctrList = []; private static readonly List<gicsHolder> NewHiSIndList = []; private static readonly List<gicsHolder> NewLoIGrpList = []; private static readonly List<gicsHolder> NewLoInduList = []; private static readonly List<gicsHolder> NewLoSctrList = []; private static readonly List<gicsHolder> NewLoSIndList = []; private static bool _inErrorState; // DataSet and related info private DataSet ds; private string dsName; private int oneYr; // Initialize is called once per symbol instance public override void Initialize(BarHistory bars) { if (_inErrorState) { return; } // Register this instance for the current symbol StrategyInstances[bars.Symbol] = this; // Output the current thread id for debugging //WriteToDebugLog($"Initialize called on Thread ID: {Thread.CurrentThread.ManagedThreadId}"); // Set up chart pane and display options SetPaneDrawingOptions("Price", 100); var cds = new ChartDisplaySettings { ShowVolumePane = false, // Hide volume pane PaneSeparatorWidth = 0 // Hide pane separator lines }; SetChartDrawingOptions(cds); // Apply chart settings // Plot GICS info of clicked symbol in Price Pane var symbol = bars.Symbol; var tab = '\t'; // Retrieve GICS metadata for the symbol using encapsulated method var gicsInfo = GicsInfo.FromSymbol(symbol); if (gicsInfo != null) { // Display GICS hierarchy in the chart header DrawHeaderText(symbol + ": " + tab + gicsInfo.SectorName + " (" + gicsInfo.Sector + ") \\ ", WLColor.Aqua, 12); DrawHeaderText(tab + " " + gicsInfo.IndustryGroupName + " (" + gicsInfo.IndustryGroup + ") \\ ", WLColor.MediumAquamarine, 12); DrawHeaderText(tab + " " + gicsInfo.IndustryName + " (" + gicsInfo.Industry + ") \\ ", WLColor.SlateBlue, 12); DrawHeaderText(tab + " " + gicsInfo.SubIndustryName + " (" + gicsInfo.SubIndustry + ") ", WLColor.OliveDrab, 12); } else { DrawHeaderText(symbol + ": No GICS info available", WLColor.Red, 12); } DrawHeaderText(" "); //---------- // Determine the number of bars in one year based on the chart scale if (bars.Scale == HistoryScale.Daily) { oneYr = 252; } else if (bars.Scale == HistoryScale.Weekly) { oneYr = 52; } else if (bars.Scale == HistoryScale.Monthly) { oneYr = 12; } else { _inErrorState = true; WriteToDebugLog("Change Scale to Daily, Weekly or Monthly", false); return; } // Set the start index for calculations StartIndex = oneYr + 1; DrawHeaderText(" "); dsName = ExecutionDataSetName; if (string.IsNullOrWhiteSpace(dsName)) { DrawHeaderText("Single Symbol: " + bars.Symbol, WLColor.LightGray, 12); } else { ds = WLHost.Instance.FindDataSet(dsName); DrawHeaderText("DataSet: " + dsName, WLColor.Tan, 15); DrawHeaderText("# of Symbols in Dataset = " + ds.Symbols.Count, WLColor.Tan, 13); } // Abort if it's not a Norgate dataset, Norgate provides GICS info for its own symbols only //if (!dsName.Contains("Norgate")) //{ //DrawHeaderText("Strategy terminated as it only works with Norgate datasets!", WLColor.NeonFuschia, 15); //return; //} // you can call ProcessSymbol here if you want to process the current symbol immediately // otherwise, it will be processed in BacktestComplete ProcessSymbol(bars); } // No per-bar logic in this strategy public override void Execute(BarHistory bars, int idx) { } // Called once at the start of the backtest public override void BacktestBegin() { _inErrorState = false; // Reset error state for each backtest // Clear StrategyInstances at the start of each backtest to avoid stale data StrategyInstances.Clear(); // Initialize the 52-week new high and low counters // These dictionaries will hold the count of new highs and lows for each date // They are initialized with a capacity of 1000 to help performance and avoid some resizing _52WeekNHCount = new Dictionary<DateTime, int>(1000); _52WeekNLCount = new Dictionary<DateTime, int>(1000); // Clear all static GICS lists at the start of each run NewHiIGrpList.Clear(); NewHiInduList.Clear(); NewHiSctrList.Clear(); NewHiSIndList.Clear(); NewLoIGrpList.Clear(); NewLoInduList.Clear(); NewLoSctrList.Clear(); NewLoSIndList.Clear(); } // Called once after all symbols have been processed public override void BacktestComplete() { if (_inErrorState) { return; } ProcessAllSymbols(); InitializeCounterTimeSeries(); // Plot the synchronized time series for each symbol PlotAll(); PrintSectorAndIndustryOutputs(); } /// <summary> /// Initializes the _52WeekNH and _52WeekNL TimeSeries from the tallied counts in the dictionaries. /// This method is called after all symbols have been processed, and ensures that the TimeSeries /// are constructed with all dates encountered across the dataset, ready for plotting and analysis. /// </summary> private void InitializeCounterTimeSeries() { // create the TimeSeries for 52-week new highs and lows // make sure they're empty so Add works correctly _52WeekNH = new TimeSeries(); _52WeekNL = new TimeSeries(); // _52WeekNHCount and _52WeekNLCount are guaranteed to have the same keys (dates) foreach (var date in _52WeekNHCount.Keys) { _52WeekNH.Add(_52WeekNHCount[date], date); _52WeekNL.Add(_52WeekNLCount[date], date); } } /// <summary> /// Iterates over all registered strategy instances and processes each symbol's BarHistory /// to tally new highs/lows and collect GICS information. Called once in BacktestComplete /// to aggregate results across the entire dataset. /// </summary> private void ProcessAllSymbols() { // if you called ProcessSymbol from Initialize, then _52WeekNHCount and _52WeekNLCount // will already have data, so we can skip processing if they are not empty if (_52WeekNHCount.Count != 0) { return; } foreach (var strategyInstance in StrategyInstances.Values) { ProcessSymbol(strategyInstance.CurrentBars); } } /// <summary> /// Processes a single symbol's data for new highs/lows and GICS analysis. /// </summary> private void ProcessSymbol(BarHistory bars) { const double tolerance = 0.0001; var sym = bars.Symbol; try { WriteToStatusBar("Processing " + sym); // Update status bar var high = bars.High; var low = bars.Low; var firstValidBar = high.FirstValidIndex; var lastBar = bars.Count - 1; // use local variables for a performance boost var weekNhCount = _52WeekNHCount; var weekNlCount = _52WeekNLCount; if (bars.Count >= firstValidBar + StartIndex) // Symbol has enough data { TimeSeries HH1yr = Highest.Series(high, oneYr); TimeSeries LL1yr = Lowest.Series(low, oneYr); for (var bar = firstValidBar + StartIndex; bar < bars.Count; bar++) { var currentDate = bars.DateTimes[bar].Date; // IMPORTANT! Insure we have the current date in both counter dictionaries weekNhCount.TryAdd(currentDate, 0); // does nothing if the date already exists weekNlCount.TryAdd(currentDate, 0); // does nothing if the date already exists // Check for new 1-year high if (Math.Abs(high[bar] - HH1yr[bar]) < tolerance) { weekNhCount[currentDate] += 1; // On last bar (only) analyze NewHi for GICS info if (bar == lastBar) { AnalyzeNewHighGICS(sym); } } // Check for new 1-year low if (Math.Abs(low[bar] - LL1yr[bar]) < tolerance) { weekNlCount[currentDate] += 1; // On last bar (only) analyze NewLo for GICS info if (bar == lastBar) { AnalyzeNewLowGICS(sym); } } } } } catch (Exception e) { // Log any exceptions that occur during processing WLHost.Instance.AddLogItem("GlobalExec", sym + " " + e.Message, WLColor.Red); } } /// <summary> /// Analyzes GICS information for a symbol making a new high. /// </summary> private void AnalyzeNewHighGICS(string sym) { var gicsInfo = GicsInfo.FromSymbol(sym); if (gicsInfo != null) { AddToGicsHolderList(NewHiSctrList, gicsInfo.Sector, gicsInfo.SectorName, sym); AddToGicsHolderList(NewHiIGrpList, gicsInfo.IndustryGroup, gicsInfo.IndustryGroupName, sym); AddToGicsHolderList(NewHiInduList, gicsInfo.Industry, gicsInfo.IndustryName, sym); AddToGicsHolderList(NewHiSIndList, gicsInfo.SubIndustry, gicsInfo.SubIndustryName, sym); } } /// <summary> /// Analyzes GICS information for a symbol making a new low. /// </summary> private void AnalyzeNewLowGICS(string sym) { var gicsInfo = GicsInfo.FromSymbol(sym); if (gicsInfo != null) { AddToGicsHolderList(NewLoSctrList, gicsInfo.Sector, gicsInfo.SectorName, sym); AddToGicsHolderList(NewLoIGrpList, gicsInfo.IndustryGroup, gicsInfo.IndustryGroupName, sym); AddToGicsHolderList(NewLoInduList, gicsInfo.Industry, gicsInfo.IndustryName, sym); AddToGicsHolderList(NewLoSIndList, gicsInfo.SubIndustry, gicsInfo.SubIndustryName, sym); } } /// <summary> /// Adds a symbol to the appropriate gicsHolder list, creating a new holder if necessary. /// </summary> private void AddToGicsHolderList(List<gicsHolder> list, string gics, string gicsDescription, string sym) { // Find existing holder for this GICS code var holder = list.Find(gh1 => gh1.gics == gics); if (holder != null) { holder.gicsList.Add(sym); } else { // Create new holder if not found list.Add(new gicsHolder { gics = gics, gicsDescription = gicsDescription, gicsList = [sym] }); } } /// <summary> /// Handles plotting logic for the strategy. /// </summary> private void PlotAll() { foreach (var strategyInstance in StrategyInstances.Values) { // Synchronize the global _52WeekNH and _52WeekNL series to the current symbol's BarHistory. // This ensures the time series aligns with the bars of the symbol being plotted, // so that the plot displays correctly even if the symbol has missing or different dates. var _52NHSynch = TimeSeriesSynchronizer.Synchronize(_52WeekNH, strategyInstance.CurrentBars); _52NHSynch.Description = "1yr New Highs (" + strategyInstance.CurrentBars.Scale + ")"; var _52NLSynch = TimeSeriesSynchronizer.Synchronize(_52WeekNL, strategyInstance.CurrentBars); _52NLSynch.Description = "1yr New Lows (" + strategyInstance.CurrentBars.Scale + ")"; // Plot 1yr New Highs in its own pane strategyInstance.SetPaneDrawingOptions("pNH", 13, 35); strategyInstance.PlotTimeSeriesLine(_52NHSynch, _52NHSynch.Description, "pNH", WLColor.LawnGreen, 1); // Plot 1yr New Lows in its own pane strategyInstance.SetPaneDrawingOptions("pNL", 13, 40); strategyInstance.PlotTimeSeriesLine(_52NLSynch, _52NLSynch.Description, "pNL", WLColor.OrangeRed, 1); // The difference series is also synchronized to the current symbol's bars for correct plotting. var _52WeekHminusL = _52NHSynch - _52NLSynch; _52WeekHminusL.Description = "1yr New Highs - 1yr New Lows"; strategyInstance.SetPaneDrawingOptions("pHL", 15, 25); strategyInstance.PlotTimeSeries(_52WeekHminusL, _52WeekHminusL.Description, "pHL", WLColor.Blue, PlotStyle.ThickHistogram); } } /// <summary> /// Outputs sector and industry group information for new highs and new lows. /// </summary> private void PrintSectorAndIndustryOutputs() { // New Highs - Sector info var sectorNewHi = OutputSortedListToList.GenerateOutput(this, "New Highs, by Sector", NewHiSctrList); foreach (var line in sectorNewHi) { WriteToDebugLog(line); } // New Highs - Industry Group info var indGrpNewHi = OutputSortedListToList.GenerateOutput(this, "New Highs, by Industry Group", NewHiIGrpList); foreach (var line in indGrpNewHi) { WriteToDebugLog(line); } // New Lows - Sector info var sectorNewLo = OutputSortedListToList.GenerateOutput(this, "New Lows, by Sector", NewLoSctrList); foreach (var line in sectorNewLo) { WriteToDebugLog(line); } // New Lows - Industry Group info var indGrpNewLo = OutputSortedListToList.GenerateOutput(this, "New Lows, by Industry Group", NewLoIGrpList); foreach (var line in indGrpNewLo) { WriteToDebugLog(line); } // Add more printouts, as needed } /// <summary> /// Holds all GICS metadata for a symbol and encapsulates retrieval logic. /// </summary> private class GicsInfo { public string Industry; public string IndustryGroup; public string IndustryGroupName; public string IndustryName; public string Sector; public string SectorName; public string SubIndustry; public string SubIndustryName; /// <summary> /// Factory method to retrieve all GICS metadata for a symbol in a single call. /// </summary> public static GicsInfo FromSymbol(string sym) { var gics = Metadata.ClassificationAtLevel(sym, "GICS", 1); if (string.IsNullOrEmpty(gics)) { return null; } return new GicsInfo { Sector = Metadata.CorrespondingIndustryIndex(sym, "$SP1500", 1, "PR"), SectorName = Metadata.ClassificationDescriptionAtLevel(sym, "GICS", 1), IndustryGroup = Metadata.CorrespondingIndustryIndex(sym, "$SP1500", 2, "PR"), IndustryGroupName = Metadata.ClassificationDescriptionAtLevel(sym, "GICS", 2), Industry = Metadata.CorrespondingIndustryIndex(sym, "$SP1500", 3, "PR"), IndustryName = Metadata.ClassificationDescriptionAtLevel(sym, "GICS", 3), SubIndustry = Metadata.CorrespondingIndustryIndex(sym, "$SP1500", 4, "PR"), SubIndustryName = Metadata.ClassificationDescriptionAtLevel(sym, "GICS", 4) }; } } } //============================================================ /// <summary> /// Holds GICS classification and associated symbols. /// </summary> public class gicsHolder { public string gics; public string gicsDescription; public List<string> gicsList = []; } /// <summary> /// Utility class for generating formatted output from GICS holder lists. /// </summary> public static class OutputSortedListToList { /// <summary> /// Generates a formatted list of strings for output, sorted by GICS code. /// </summary> public static List<string> GenerateOutput(UserStrategyBase obj, string Header, List<gicsHolder> List) { var outputList = new List<string>(); if (List.Count > 0) { //obj.WriteToDebugLog("Generating output for " + Header); var sortedList = List.OrderBy(h => h.gics).ToList(); var gicsWidth = Math.Max("GICS".Length, List.Max(h => h.gics?.Length ?? 0)) + 2; var descWidth = Math.Max("Description".Length, List.Max(h => h.gicsDescription?.Length ?? 0)) + 2; var symbolWidth = Math.Max("Symbol".Length, List.SelectMany(h => h.gicsList).DefaultIfEmpty("").Max(s => s?.Length ?? 0)) + 2; outputList.Add(""); outputList.Add("// " + Header); outputList.Add( $"{"GICS".PadRight(gicsWidth)}{"Description".PadRight(descWidth)}{"Symbol".PadRight(symbolWidth)}"); outputList.Add($"{new string('-', gicsWidth)}{new string('-', descWidth)}{new string('-', symbolWidth)}"); foreach (var holder in sortedList) { foreach (var symbol in holder.gicsList) { outputList.Add( $"{holder.gics.PadRight(gicsWidth)}" + $"{holder.gicsDescription.PadRight(descWidth)}" + $"{symbol.PadRight(symbolWidth)}" ); } outputList.Add(""); } } return outputList; } } /// <summary> /// Proxy stub for the Norgate Metadata class, which provides fundamental and classification information for equities. /// This stub returns placeholder values for demonstration and testing purposes. /// </summary> public static class Metadata { // Returns a classification code at a given level for a symbol (e.g., GICS sector, industry, etc.) public static string ClassificationAtLevel(string symbol, string classificationType, int level) => // Stub: return a placeholder string based on inputs $"{classificationType}_L{level}_{symbol}"; // Returns a description for a classification at a given level for a symbol public static string ClassificationDescriptionAtLevel(string symbol, string classificationType, int level) => // Stub: return a placeholder description $"{classificationType} Description L{level} for {symbol}"; // Returns the corresponding industry index for a symbol at a given level public static string CorrespondingIndustryIndex(string symbol, string indexName, int level, string type) => // Stub: return a placeholder industry index $"{indexName}_L{level}_{type}_{symbol}"; } }
Sorry for the late response, Paul, was busy yesterday.
I'm pretty happy with the previous version (Post #16).
However, I did check out the latest version and found that the New Highs (NH), New Lows (NL) timeseries are unreliable. Here's how to uncover:
- Run the previous version on, say, Naz 100, Weekly scale. Keep it open for reference.
- Run the new version in an identical manner (Naz 100, weekly). (a) Sometimes you'll see a mismatch in the NH/NL count on the very first run and that confirms the issue with the time series (the prev vrsn is correct, I've checked it countless times + I also ran my old vrsn). OR you can confirm by comparing with # of symbols printed in debug window which is *always* correct. (b) If the plot values look identical, run it in, say, Quarterly scale which will kick it into Error State, then back in original scale and look at the NH/NL plots, they'll likely show different values. You may have to do this a few times for the issue to surface. Compare with prev vrsn or debug window printout to confirm the mismatch.
I tried a simple fix (which I use in the prev vrsn, by the way):
Initially, it seemed to work but when I ran it many times sure enough the NH/NL time series went out of whack. So I don't really know the source of the issue.
Hope this analysis helped.
P.S. You don't have to fix this (other than for intellectual curiosity or to teach the AI), I'm pretty happy with the previous vrsn.
I'm pretty happy with the previous version (Post #16).
However, I did check out the latest version and found that the New Highs (NH), New Lows (NL) timeseries are unreliable. Here's how to uncover:
- Run the previous version on, say, Naz 100, Weekly scale. Keep it open for reference.
- Run the new version in an identical manner (Naz 100, weekly). (a) Sometimes you'll see a mismatch in the NH/NL count on the very first run and that confirms the issue with the time series (the prev vrsn is correct, I've checked it countless times + I also ran my old vrsn). OR you can confirm by comparing with # of symbols printed in debug window which is *always* correct. (b) If the plot values look identical, run it in, say, Quarterly scale which will kick it into Error State, then back in original scale and look at the NH/NL plots, they'll likely show different values. You may have to do this a few times for the issue to surface. Compare with prev vrsn or debug window printout to confirm the mismatch.
I tried a simple fix (which I use in the prev vrsn, by the way):
CODE:
      //private static bool _inErrorState;
      private bool _inErrorState; // static keyword removed
Initially, it seemed to work but when I ran it many times sure enough the NH/NL time series went out of whack. So I don't really know the source of the issue.
Hope this analysis helped.
P.S. You don't have to fix this (other than for intellectual curiosity or to teach the AI), I'm pretty happy with the previous vrsn.
The bug was due to me thinking that doing an Add to a TimeSeries (which is a subclass of DateSynchedList<DateTime>) would always keep items in date order. Ooops. That is not the case. So, here is the easy fix by swapping-in this fixed version of InitializeCounterTimeSeries(). (Notice the OrderBy).
CODE:
        /// <summary>
        ///     Initializes the _52WeekNH and _52WeekNL TimeSeries from the tallied counts in the dictionaries.
        ///     This method is called after all symbols have been processed, and ensures that the TimeSeries
        ///     are constructed with all dates encountered across the dataset, ready for plotting and analysis.
        /// </summary>
        private void InitializeCounterTimeSeries()
        {
            // create the TimeSeries for 52-week new highs and lows
            // make sure they're empty so Add works correctly
            _52WeekNH = new TimeSeries();
            _52WeekNL = new TimeSeries();

            // _52WeekNHCount and _52WeekNLCount are guaranteed to have the same keys (dates).
            // And, make sure we iterate in date order!
            foreach (var date in _52WeekNHCount.Keys.OrderBy(d => d))
            {
                _52WeekNH.Add(_52WeekNHCount[date], date);
                _52WeekNL.Add(_52WeekNLCount[date], date);
            }
        }
Works OK now 👍
Your Response
Post
Edit Post
Login is required