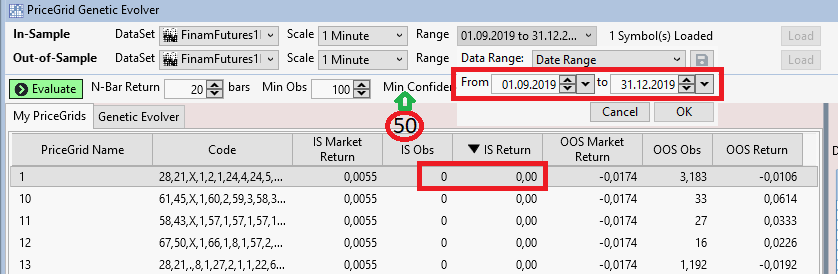
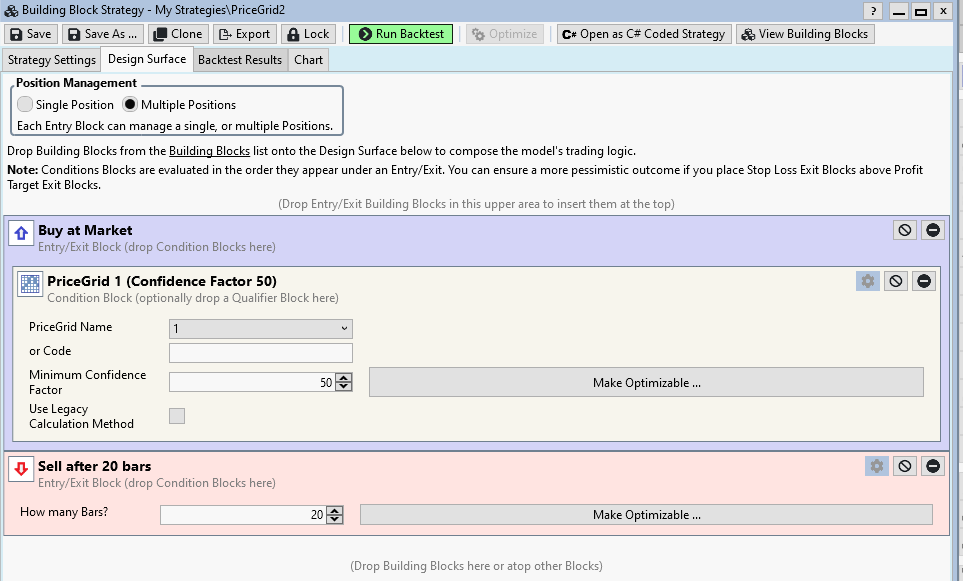
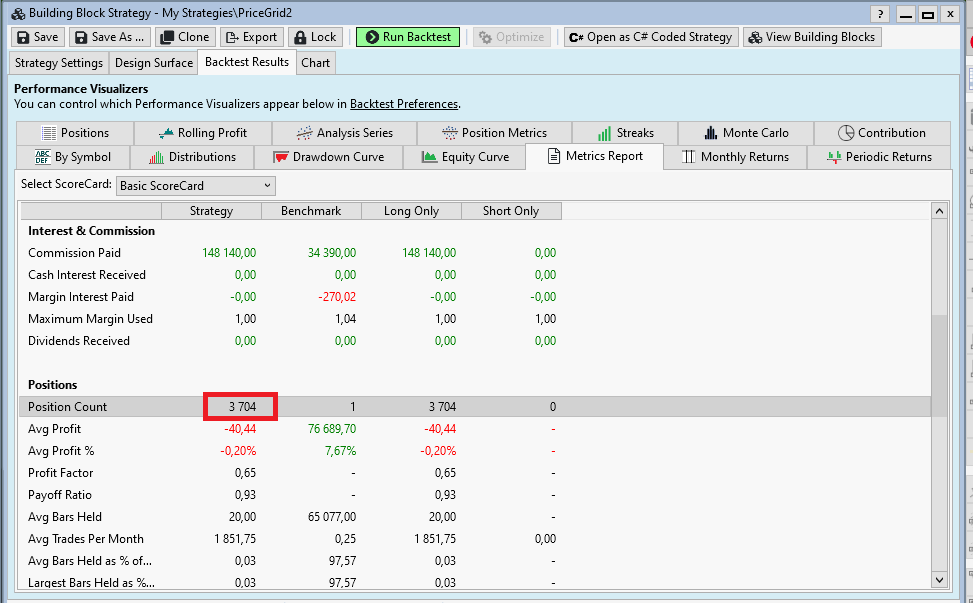
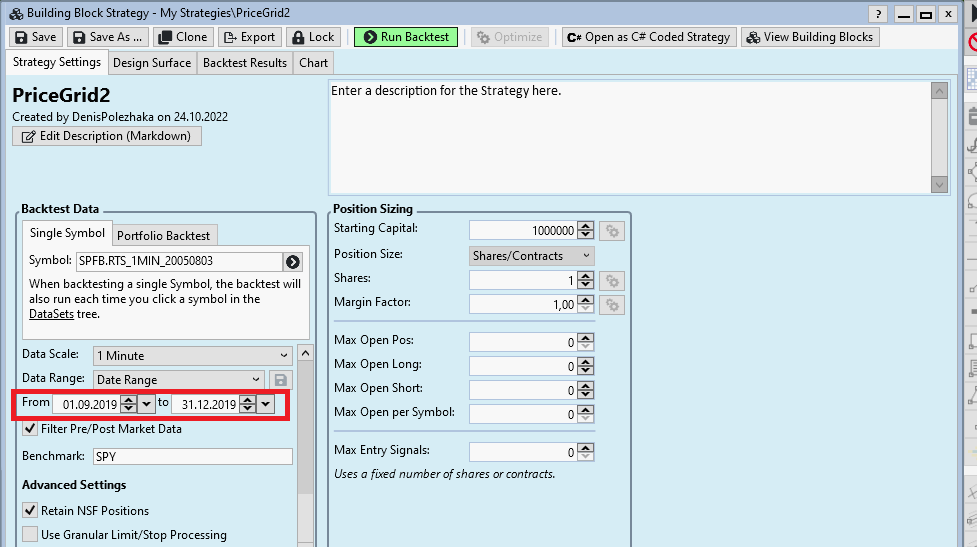
I decided to find out how "Genetic Evolver" works. Namely, how the evaluation of the pattern "1" works. I have designed a strategy that trades this pattern in "Buy". I tested on the same time period and trading instrument settings. "Genetic Evolver" in the "IS Obs" column shows a value of 0. While the adviser backtester successfully detects 3704 trades occurrences of this pattern. How could this happen? I expected the values to match.
Rename
Given what you're showing, sure it seems strange. With 3700 trades in that date range, and exiting after 20 bars, it kind of sounds like you're getting a detection on every bar.
I'll just say that it's really odd that your first image is edited not to show the actual confidence factor by plastering an image of a date control that doesn't even exist in that tool. Why would you do that?
Of course, the image could even be edited to show a different factor that wasn't even used, but okay, we'll take your word for it.
Hello Cone!
1. For a more complete expression of the question, I expanded the "Data Range" and highlighted it in red. "Data Range" blocked "Min Confidence". Therefore, I had to indicate "Min Confidence" below by editing.
2. You can download the testing tool from this link.
The link is in the post below.
This tool has been around since 2005.
3. I also send you a test pattern "1" from "String Token": 28,21,X,1,2,1,24,4,24,5,27,1,1,1,25,1,1, 1,1,1,23,1,1,3,23,5,8,4,11,3,1,1,6,1,1,4,12,1,2,1,1,1, 4,3,1,4,13,1,1,2,1,5,1,1,1,2,13,7,6,3,1,2,10,5,8,5,12, 1,11,4,27,2,27,1,27,1,27,1,27,1,27,1,27,1,27,1
You can do the above steps yourself and you will see that everything works as I described to you.
Cone,
Here is the correct link to the tested quotes:
https://drive.google.com/file/d/1sq8388mTC1EO48lIh0TcLKGuyy4tzuKR/view?usp=sharing
The link above is wrong.
Here is the correct link to the tested quotes:
https://drive.google.com/file/d/1sq8388mTC1EO48lIh0TcLKGuyy4tzuKR/view?usp=sharing
The link above is wrong.
editing....
Your Response
Post
Edit Post
Login is required