Does WL have, or is it possible to develop, an indicator that shows the Open and Realized profit as a strategy equity curve?
Other platforms have this implemented as a pane at the bottom of the chart that shows a histogram of realized, and a line of open profit/loss.
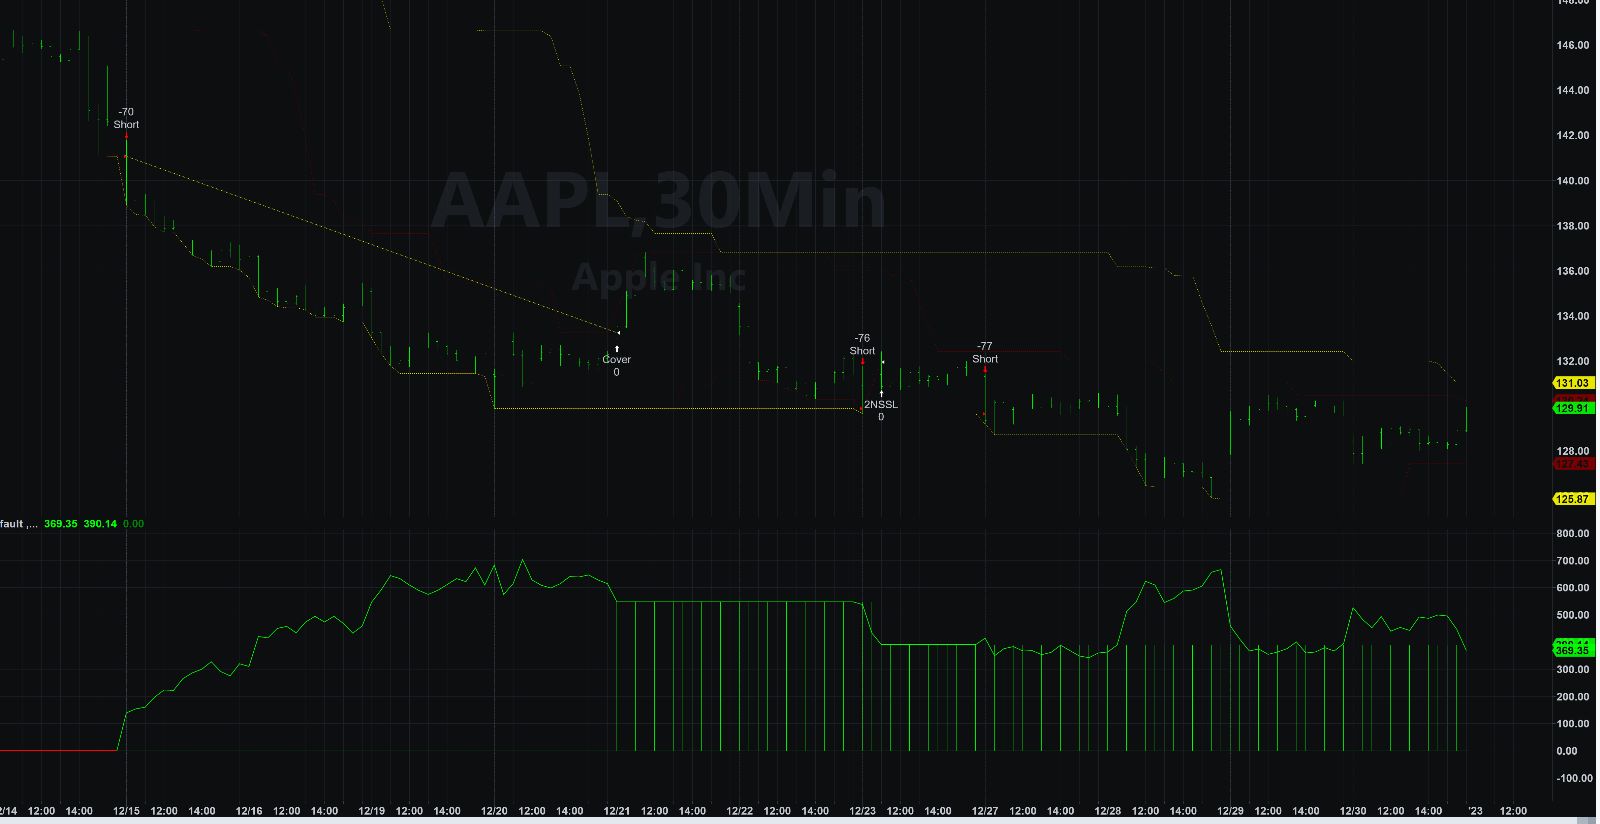
Other platforms have this implemented as a pane at the bottom of the chart that shows a histogram of realized, and a line of open profit/loss.
Rename
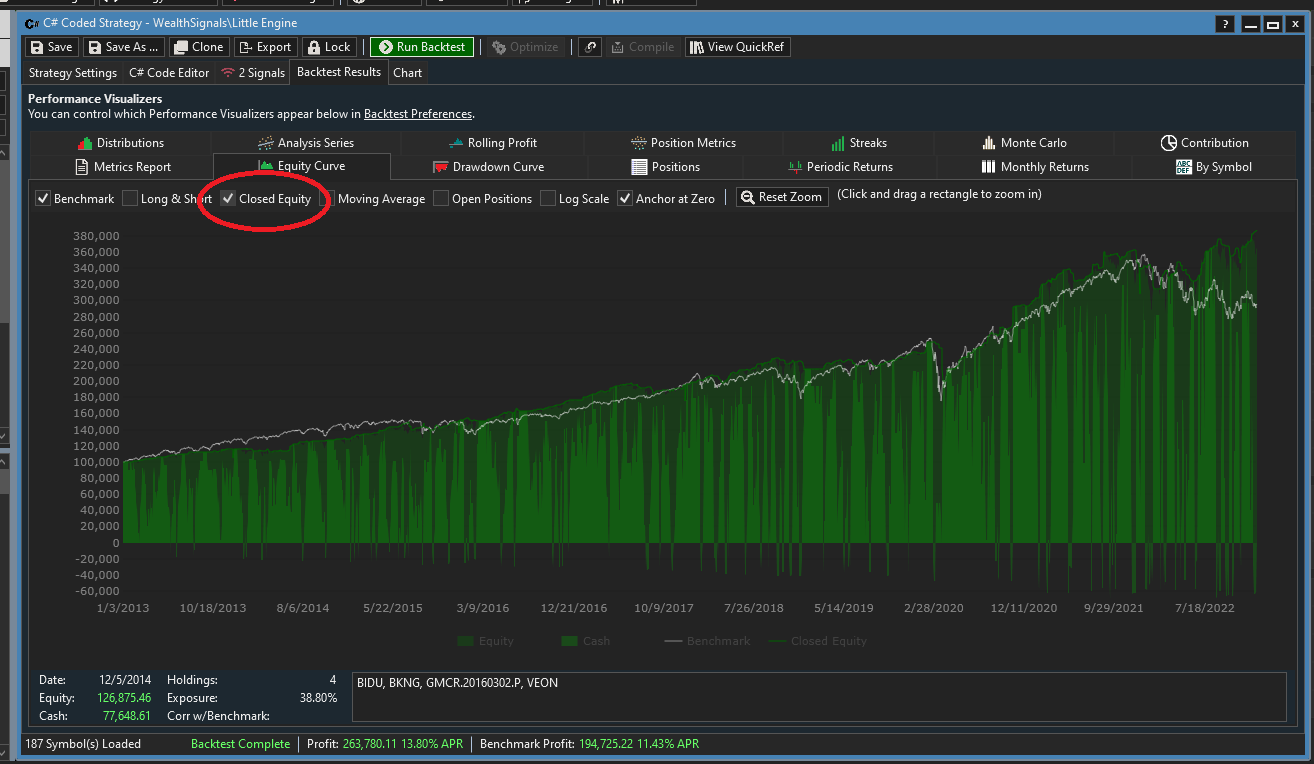
You can see it in the Equity Curve if you turn on "Closed Equity".
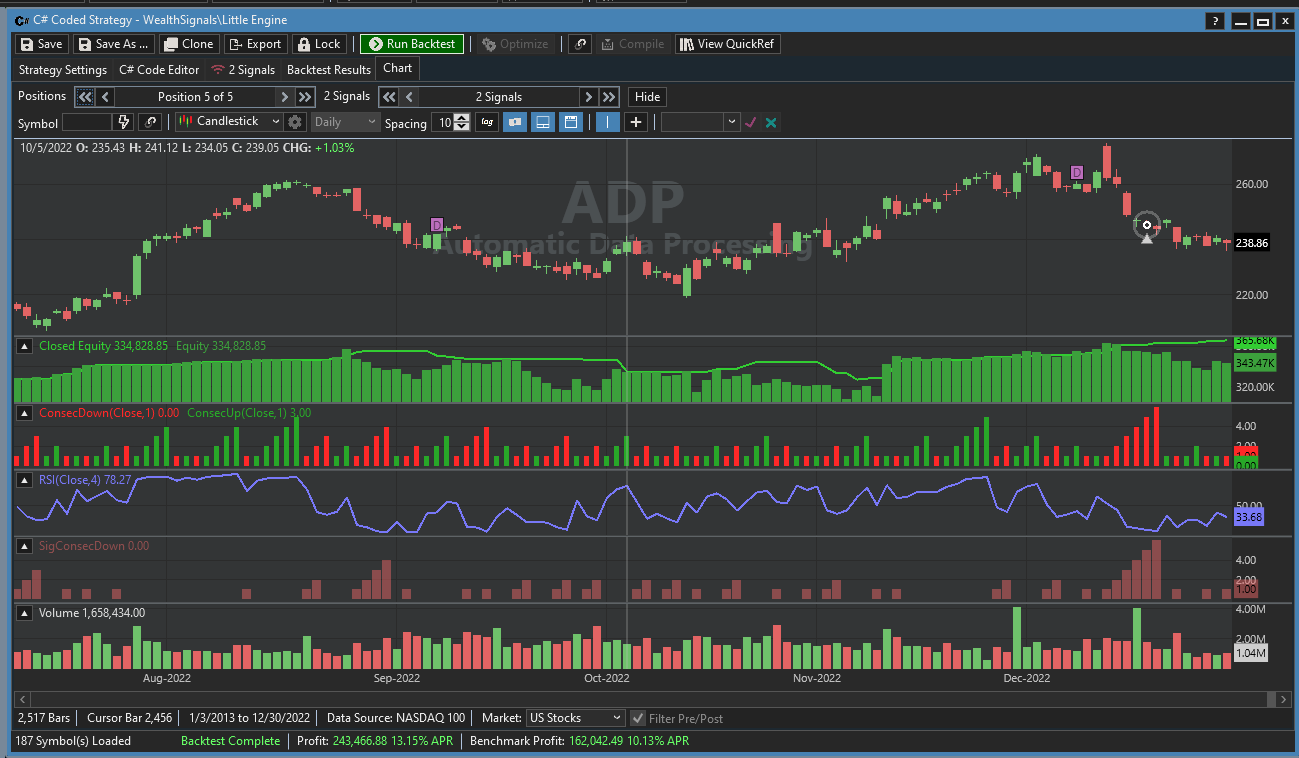
Thanks Glitch. I would like to see this in correlation to the price bars. Is there a way to add this to a chart as a pane?
Sure, there are examples of that in our forum:
More averaging indicator choices to operate on backtest results Equity curve
More averaging indicator choices to operate on backtest results Equity curve
While plotting the Equity Curve in the Strategy is easy, I ran into some trouble plotting the Closed Equity, but rectified things for Build 27. When B27 is released you can use this code to plot both:
CODE:

        //plot equity and closed equity
        public override void Cleanup(BarHistory bars)
        {
         TimeSeries eq = TimeSeriesSynchronizer.Synchronize(Backtester.EquityCurve, bars);
         PlotTimeSeries(eq, "Equity", "Equity", WLColor.DarkGreen, PlotStyle.ThickHistogram);
         TimeSeries ceq = TimeSeriesSynchronizer.Synchronize(Backtester.ClosedEquity, bars);
         PlotTimeSeries(ceq, "Closed Equity", "Equity", WLColor.LimeGreen, PlotStyle.Line);
        }
Sounds and looks great! Thanks Glitch! Looking forward to trying it out!
Your Response
Post
Edit Post
Login is required