I usually use Exhaustive optimization as it's much faster. Several days ago I switched to Non-parallel, as one of my strategies uses Pre-Execute. Then I returned the settings to the original Exhaustive.
I have Core i9 13980HX processor with 24 physical cores and 32 threads.
When I run the following simple strategy:
On SPY, 20 last years.
I get the following stats:
1. Non-parallel: 68 seconds
2. Parallel: 57 seconds.
So parallel calculations almost don't work. I tried to change the selection several times, no luck.
Task manager shows 2.5-3.5% CPU load by WL8 in parallel mode.
What can be wrong?
Thank you
I have Core i9 13980HX processor with 24 physical cores and 32 threads.
When I run the following simple strategy:
CODE:
public class TestParallel : UserStrategyBase
   {
      public TestParallel()
      {
         AddParameter("Fake param", ParameterType.Int32, 1, 1, 100, 1);
      }

      public override void Execute(BarHistory bars, int bar)
      {
         if (HasOpenPosition(bars, PositionType.Long))
            PlaceTrade(bars, TransactionType.Sell, OrderType.MarketClose);

         if (!HasOpenPosition(bars, PositionType.Long))
            PlaceTrade(bars, TransactionType.Buy, OrderType.MarketClose);
      }
   }
}
On SPY, 20 last years.
I get the following stats:
1. Non-parallel: 68 seconds
2. Parallel: 57 seconds.
So parallel calculations almost don't work. I tried to change the selection several times, no luck.
Task manager shows 2.5-3.5% CPU load by WL8 in parallel mode.
What can be wrong?
Thank you
Rename
The Exhaustive Optimizer uses a .NET Parallel.ForEach using the following code:
The second parameter is an instance of ParallelOptions, which controls how many cores are used. We have a utility class called ParallelUtils that queries the OS to return the appropriate value. You can run a Strategy like this to examine the value, what does it print in the Debug output?
Note: You'll need to enable System.Threading.Tasks.Parallel in the WL8 Assembly References tool.
CODE:
Parallel.ForEach<List<double>>(pl.GetValuesEnumerator(), ParallelUtils.ParallelOptions, item =>
{
The second parameter is an instance of ParallelOptions, which controls how many cores are used. We have a utility class called ParallelUtils that queries the OS to return the appropriate value. You can run a Strategy like this to examine the value, what does it print in the Debug output?
CODE:

using WealthLab.Backtest;
using System;
using WealthLab.Core;
using WealthLab.Data;
using WealthLab.Indicators;
using System.Collections.Generic;
using System.Threading.Tasks;

namespace WealthScript1
{
    public class MyStrategy : UserStrategyBase
    {
        //create indicators and other objects here, this is executed prior to the main trading loop
        public override void Initialize(BarHistory bars)
        {
         ParallelOptions po = ParallelUtils.ParallelOptions;
         WriteToDebugLog("Cores=" + po.MaxDegreeOfParallelism);
        }

        //execute the strategy rules here, this is executed once for each bar in the backtest history
        public override void Execute(BarHistory bars, int idx)
        {
            if (!HasOpenPosition(bars, PositionType.Long))
            {
                //code your buy conditions here
            }
            else
            {
                //code your sell conditions here
            }
        }

        //declare private variables below

    }
}
Note: You'll need to enable System.Threading.Tasks.Parallel in the WL8 Assembly References tool.
Thank you for the debugging instructions. I believe the problem was caused by some wrong Windows configuration and your solution would have identified the problem.
Unfortunatelly I couldn't repro the issue anymore.
Whole story: I have Win11, my laptop's Intel mainboard died, I moved SSDs to an old laptop with AMD, then my Intel laptop was fixed, I returned SSDs, and the problem appeared (but I didn't realize it was connected). As Win11 had AMD drivers installed, I believe that there were some problems with CPU parallel options. It didn't appear in any other apps, except for WL8. I restored Win11 from a backup prior to putting SSDs to the AMD laptop, so it's clean and fine now. With no other actions the same processing takes only 3-4 seconds.
Now the result is as expected:
Thank you very much!
Unfortunatelly I couldn't repro the issue anymore.
Whole story: I have Win11, my laptop's Intel mainboard died, I moved SSDs to an old laptop with AMD, then my Intel laptop was fixed, I returned SSDs, and the problem appeared (but I didn't realize it was connected). As Win11 had AMD drivers installed, I believe that there were some problems with CPU parallel options. It didn't appear in any other apps, except for WL8. I restored Win11 from a backup prior to putting SSDs to the AMD laptop, so it's clean and fine now. With no other actions the same processing takes only 3-4 seconds.
Now the result is as expected:
CODE:
---Symbol by Symbol Debug Logs---
---SPY---
Cores=31
Thank you very much!
That's quite a difference, glad things are running smoothly now!
The problem returned again. No new drivers, same on B143-145, no changes, even no reboot. Worked fast, then starting some new run very slow. Nothing helps. All other apps are fast as usual.
Extremely slow 1-core processing with 3% in TaskManager, although Exhaustive option is selected.
Your code above outputs:
---Symbol by Symbol Debug Logs---
---SPY---
Cores=31
Could you please suggest what to check in addition to that?
Thank you
Extremely slow 1-core processing with 3% in TaskManager, although Exhaustive option is selected.
Your code above outputs:
---Symbol by Symbol Debug Logs---
---SPY---
Cores=31
Could you please suggest what to check in addition to that?
Thank you
Let’s set up a Zoom support call so I can see what’s happening, email support@wealth-lab.com.
Glitch, thank you for the prompt answer!
I identified the reason for the issue, it's caused by my libraries being copied to WealthLab directory.
So I was working on adding TorchSharp, as mentioned here:
https://www.wealth-lab.com/Discussion/Custom-library-not-shows-up-in-Tools-Assembly-References-9824
When these libraries are in WL folder:
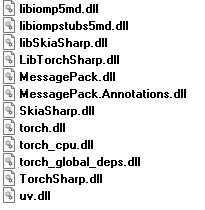
I get this slowdown in strategies that don't use any of the above mentioned libs/functionality. So something very primitive that enters each day and exits the next date only consumes 1 core during optimization.
I have no idea, why unused libraries (although they are loaded during WL startup) cause complete suspending of parallelism, but at least I have a way to workaround: have two folders, one with and another without the libs. The problem is that I will need to optimize TorchSharp strategies.
If you like, I can send you the archive with libs
Thank you
I identified the reason for the issue, it's caused by my libraries being copied to WealthLab directory.
So I was working on adding TorchSharp, as mentioned here:
https://www.wealth-lab.com/Discussion/Custom-library-not-shows-up-in-Tools-Assembly-References-9824
When these libraries are in WL folder:
I get this slowdown in strategies that don't use any of the above mentioned libs/functionality. So something very primitive that enters each day and exits the next date only consumes 1 core during optimization.
I have no idea, why unused libraries (although they are loaded during WL startup) cause complete suspending of parallelism, but at least I have a way to workaround: have two folders, one with and another without the libs. The problem is that I will need to optimize TorchSharp strategies.
If you like, I can send you the archive with libs
Thank you
Hmmm, when I developed the Deep Learning extension, I see that NuGet installs these libraries in runtimes/win-x64/native. If you check the WL8 install folder you'll find them all there. I'm not an expert but I believe that's where these native libraries should "correctly" go to avoid disruption. WL8 will try to dynamical discover any DLLs in its install folder so native DLLs like this might pose unforeseen issues.
One approach might be doing this development in a .NET class library and using NuGet to reference the torchSharp, just like Deep Learning does.
One approach might be doing this development in a .NET class library and using NuGet to reference the torchSharp, just like Deep Learning does.
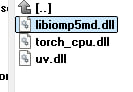
Minimum subset of libraries:
OK, thank you for the answer. But I don't have the libraries in WL folder, although I didn't install the Deep learning module. Tomorrow I will try to install the module and see if the files are installed, and if they cause the problem
OK, thank you for the answer. But I don't have the libraries in WL folder, although I didn't install the Deep learning module. Tomorrow I will try to install the module and see if the files are installed, and if they cause the problem
QUOTE:
doing this development in a .NET class library
I typically reference both Math.NET and ScottPlot this way in WL. The primary reason for this approach is to prevent namespace clashes between all these different frameworks. Those clashes are resolved in my Local.Components.dll class library. But it also prevents foreign, non-WL data types (like Matrix and Vector) from showing up in WL strategy code.
And in truth, very little changes in Local.Components.dll, so my WL strategies can easily address all these custom classes and methods.
---
I'm wondering if TorchSharp is compatible with the multi-threading WL uses?
Hello superticker,
seems that you're right and somehow the above mentioned libraries modify the way affinity/cores work. I checked in Task Manager, affinity is set to All processors, although only one core works in reality
seems that you're right and somehow the above mentioned libraries modify the way affinity/cores work. I checked in Task Manager, affinity is set to All processors, although only one core works in reality
Claude swears that the problem is with libiomp5md.dll
I'm not that keen on CPU architectures and threads to estimate if the explanation is reasonable.
## The Problem: Intel OpenMP Library Conflicts
You've discovered a **well-known issue with PyTorch/Intel OpenMP libraries** (`libiomp5md.dll`/`libiompstubs.dll`). When multiple copies of the OpenMP runtime are linked into a program, it can degrade performance or cause incorrect results.
## Why It's Happening
This error occurs when there are multiple "libiomp5.dll" files within the application. The presence of these PyTorch-related DLLs in WealthLab's folder is causing the OpenMP library to interfere with multi-threaded execution.
## Solutions
### 1. **OpenMP Environment Variables** (simplest approach)
Set these **before launching** WealthLab:
```cmd
set OMP_NUM_THREADS=8
set KMP_AFFINITY=granularity=core,scatter
set KMP_BLOCKTIME=200
```
Or add them via System Properties → Environment Variables.
### 2. **Disable Affinity Control**
```cmd
set KMP_AFFINITY=disabled
set OMP_PROC_BIND=false
```
### 3. **Remove Conflicting DLLs** (recommended)
Multiple users have solved this by deleting the libiomp5md.dll file from the environment folder. Move these files OUT of WealthLab's folder:
- `libiomp5md.dll` (or `libiompstubs.dll`)
- `torch_cpu.dll`
- `uv.dll`
Save them to a backup folder elsewhere.
### 4. **Programmatic Control** (if you have code access)
Add before library imports:
```csharp
Environment.SetEnvironmentVariable("OMP_NUM_THREADS", Environment.ProcessorCount.ToString());
Environment.SetEnvironmentVariable("KMP_AFFINITY", "disabled");
```
## Recommendation
Start with **Option 1** (environment variables) or **Option 3** (remove DLLs). Since these DLLs aren't needed for WealthLab's operation, removing them is the cleanest solution.
Your Response
Post
Edit Post
Login is required