Hello,
After download of build9, a strange thing is happening (may be it could be just a fortuity).
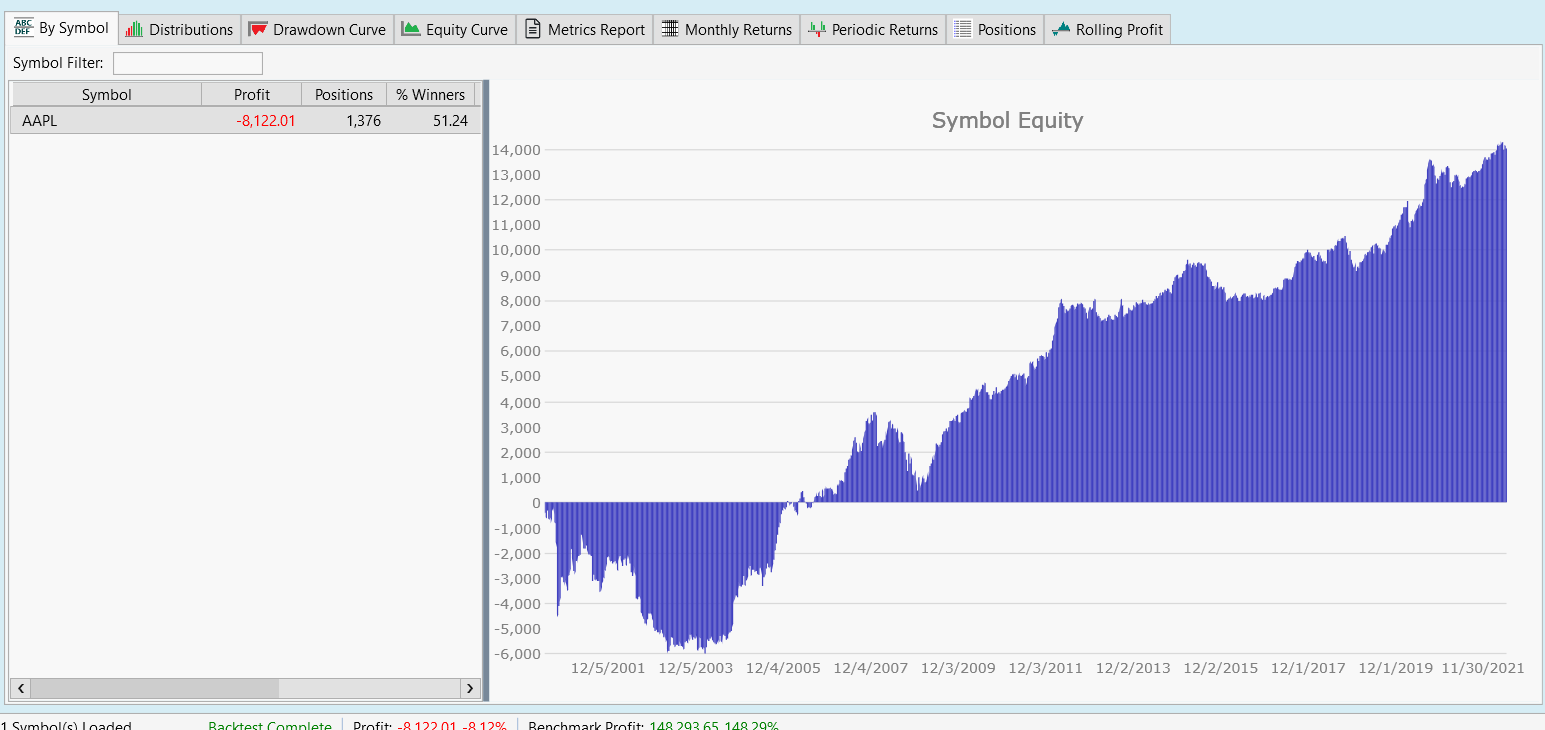
As you can see, a very easy test (but the daily low and sell after a N days counter) performed on AAPL, reports a -8112$ profit but an equity line in the "Symbol Equity" having a total different growth (the same I can see in the "Equity Curve" tab).
Which is the right ? -8112$ reported in the "By Symbol" tab or +14000$ reported in the "Symbol Equity" charts ?
Where could this trouble have origins from ?
Many thanks
Corrado

After download of build9, a strange thing is happening (may be it could be just a fortuity).
As you can see, a very easy test (but the daily low and sell after a N days counter) performed on AAPL, reports a -8112$ profit but an equity line in the "Symbol Equity" having a total different growth (the same I can see in the "Equity Curve" tab).
Which is the right ? -8112$ reported in the "By Symbol" tab or +14000$ reported in the "Symbol Equity" charts ?
Where could this trouble have origins from ?
Many thanks
Corrado
Rename
The listview is correct and probably the graph didn't update? Did you click on the item in the list? It looks like it, but maybe the select was leftover from a previous run.
Your Response
Post
Edit Post
Login is required