Comment by Eugene: topic extracted from Close outside Bollinger Band as a separate discussion.
https://forextraininggroup.com/trading-the-1-2-3-reversal-pattern-setup/
QUOTE:
I don't know what "123" means. You just need to modify the code.
https://forextraininggroup.com/trading-the-1-2-3-reversal-pattern-setup/
Rename
For this 123 Reversal (in the link above), I would "attempt" modeling it with the PeakTroughCalculator, https://www.wealth-lab.com/Support/ApiReference/PeakTroughCalculator , if I were using code. I don't know enough about Blocks to even know if it's possible with Blocks; you need to setup a 123 sequence somehow.
Even with the PeakTroughCalculator, I'm a little concerned how "soon" (in terms of the number of bars) the PeakTroughCalculator could detect a reversal in this 123 setup. It might not be the best choice either. :(
As an experienced programmer, I would prefer to develop a custom Class that would queue up each of the 3 events and characterize them for overall quality, then let the calling strategy decide if the quality measures up for a trade. This isn't a simple programming problem.
You can "try" using the Chart Pattern extension, https://www.wealth-lab.com/extension/detail/ChartPatterns , but it's based on a rigid set of dimensions, which is not really what you want. You want to characterize "behavior" instead, which won't follow any particular spacial dimensions. But it may work some of the time.
You can get most of the way there by combining the "Consecutive Peaks/Troughs" PowerPack conditions.
You just have to solve setting a Stop order at the last peak or trough, depending on the trend directions.
.. of course, the problem with using Peaks/Troughs is that they're detected by movement in the opposite direction, which could be after the stop trigger point. Therefore, you really can't use the last Peak/Trough in the pattern and would need some custom logic at that point.
I have seen the setup of this code in another program. There are defining the two bottoms and 1 high in a separate manner. Maybe the binary waves can help. I will try to figure it out.
QUOTE:
Maybe the binary waves can help.
Is there a need in it? Like Cone said in Post #2, You can get most of the way there by combining the "Consecutive Peaks/Troughs" PowerPack conditions. I agree. At the core, isn't the 1-2-3 reversal pattern simply a series of 2 consecutive Falling Peaks or Rising Troughs?
Actually, this is even easier than I thought. Consider this pattern -
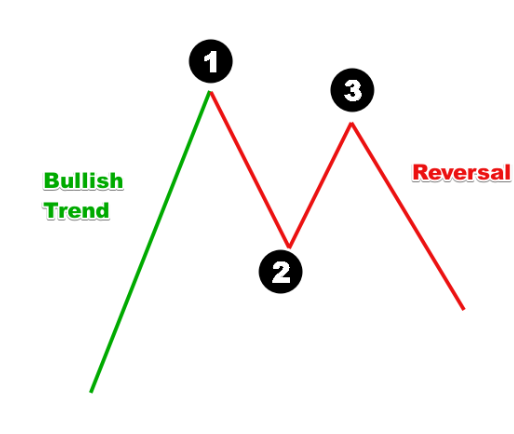
It's not required to detect 3. If the trough at 2 has formed and you can detect it, it means the market has already moved towards 3, even though you don't know where that peak will eventually be. For the pattern to be valid, that point must remain below Point 1.
Therefore, you only need to detect 2 rising troughs and then place your Short/Sell at Stop at the last trough price.
If price moves above Point 1, remove the signal because the pattern is broken.
Here's a quick example to detect that pattern.
For the "Bullish Trend" I required 3 consecutive rising troughs.
Run it on a Daily chart for a Dow 30 symbol, like HON.
The chart background is highlighted when the condition is detected and a Short at Stop order is placed at the previous trough.
For the "Bullish Trend" I required 3 consecutive rising troughs.
Run it on a Daily chart for a Dow 30 symbol, like HON.
The chart background is highlighted when the condition is detected and a Short at Stop order is placed at the previous trough.
CODE:
using WealthLab.Backtest;
using System;
using WealthLab.Core;
using WealthLab.Data;
using WealthLab.Indicators;
using System.Collections.Generic;

namespace WealthScript123
{
    public class MyStrategy : UserStrategyBase
    {
       public MyStrategy() : base()
        {
            StartIndex = 20;
        }

        public override void Initialize(BarHistory bars)
        {
         _ptc = new PeakTroughCalculator(bars, 5.00, PeakTroughReversalType.Percent);
         PlotIndicator(new ZigZagHL(bars, 5.00, PeakTroughReversalType.Percent));
         PlotStopsAndLimits(3);
        }

        public override void Execute(BarHistory bars, int idx)
        {
         int index = idx;
         Position foundPosition0 = FindOpenPosition(0);
         bool condition0;
         if (foundPosition0 == null)
         {
            if (Rising123ReversalSetup(idx, bars, _ptc))
            {
               SetBackgroundColor(bars, idx, WLColor.FromArgb(40, WLColor.Fuchsia));
               PeakTrough pt = _ptc.GetTrough(idx);
               _transaction = PlaceTrade(bars, TransactionType.Short, OrderType.Stop, pt.Value, 0, "Short At Trough");

            }
         }
         else
         {
            Backtester.CancelationCode = 1;
            if (idx - foundPosition0.EntryBar + 1 >= 5)
            {
               ClosePosition(foundPosition0, OrderType.Market, 0,"Cover after 5 bars");
            }
         }
        }

      public bool Rising123ReversalSetup(int bar, BarHistory bars, PeakTroughCalculator _ptc)
      {
         PeakTrough pt = _ptc.GetTrough(bar);
         if (pt == null)
            return false;

         //must be 3 rising troughs
         if (!_ptc.HasRisingTroughs(bar))
            return false;

         if (!_ptc.HasRisingTroughs(pt.XIndex))
            return false;

         PeakTrough pk = _ptc.GetPrevPeak(pt);
         PeakTrough tgh = _ptc.GetPrevTrough(pt);
         if (pk == null | tgh == null)
            return false;

         //has price exceed the last peak?
         if (Highest.Value(bar, bars.High, bar - pk.XIndex) > pk.Value)
            return false;

         return true;
      }


      private PeakTroughCalculator _ptc;
      private Transaction _transaction;
    }
}
QUOTE:
It's not required to detect 3. If the trough at 2 has formed and you can detect it, it means the market has already moved towards 3, even though you don't know where that peak will eventually be. For the pattern to be valid, that point must remain below Point 1.
Although I agree, that means you will be placing many pointless Short orders (which will fail) between points 2 and 3 over time. I'm just trying to decide if that's a good thing or a bad thing?
I suppose everyone is going to say it won't matter. However, if you place your Short order and the trend moves up beyond point 1, then you will loose some money for the one bar that goes beyond (and above) point 1. But it's a small amount of money to loose.
So you're going to jump into the pattern before the pattern is actually confirmed at the risk of loosing money for one bar ... or so. That's a very interesting (and gutsy) strategy and solution.
I guess I would prefer to confirm the pattern before placing my first trade, but perhaps I'm overly conservative. Also, I would prefer if WL collected statistics on "confirmed" patterns rather than "maybe" patterns. Each to his own. But thank you for this very interesting answer.
That's just the difference between trading aggressively (Short on Stop) and conservatively (Short at market on a Close below the trigger level).
One thing I learned here is that there are two ways to approach this problem.
1) Build a technical analysis C# class much like the PeakTroughCalculator that returns an analysis much like the PeakTroughs collection from the PeakTroughCalculator. That approach has the advantage that such an analysis is made available to the PreExecute{block}. But because the returned object (the analysis) contains a collection, which nonprogrammers aren't comfortable with, that puts this approach outside of Block users. This non-causal approach allows for a more in-depth analysis.
2) An on-the-fly approach method that's called by the Execute{block} to see if there's a possible opportunity coming based on the immediate past. Such a method probably could be called by Block users. But it couldn't be used in the PreExecute{block} and its internal analysis would be more limited. Certainly a hedge trader might prefer this approach.
I think which approach one uses has more to do with the psychology of the trader than the merits of the two approaches.
@ Cone
Is this the correct result for HON?

Is this the correct result for HON?
QUOTE:
For the "Bullish Trend" I required 3 consecutive rising troughs.
This is an extra condition for the bullish trend?
The code is for a bullish reversal? I want to be sure.
It's one example that assumes bullish trend with 3 consecutive ascending troughs. Change it however you like.
You can use any other indicator to determine your bullish trend, and then you'd only need the last 2 troughs to be ascending.
You can use any other indicator to determine your bullish trend, and then you'd only need the last 2 troughs to be ascending.
Thanks for the info but as i said before for an non programmer very difficult to adapt the code.
Your Response
Post
Edit Post
Login is required