When I attempt to run "Rank Symbols on Strategy" from within the "Strategy Rankings" tab, the symbol rankings are all the same, regardless of whether or not the "Use 100% Sizing" selection is checked on. What can I do differently to secure accurate rankings?
In other words, a data set of 517 symbols will ALL show 17.40 as a 6 month profit when trading on the 5 Minute. Same think happens when I change strategies, or datasets.
In other words, a data set of 517 symbols will ALL show 17.40 as a 6 month profit when trading on the 5 Minute. Same think happens when I change strategies, or datasets.
Rename
I've used the Symbol Ranking tool for ranking stocks during every weekend for the past 1.5 years. And I've never had a ranking problem with it. Exactly which ScoreCard metric(s) are you trying to rank against? Give us a screenshot like I'm showing below.
Below are my ETF symbol rankings (on a Daily scale) sorted by Sharpe Ratio. Some of the ScoreCard metrics are from a custom ScoreCard implementation (e.g. WtdAv5ProfitPct), but many are from the Basic ScoreCard.
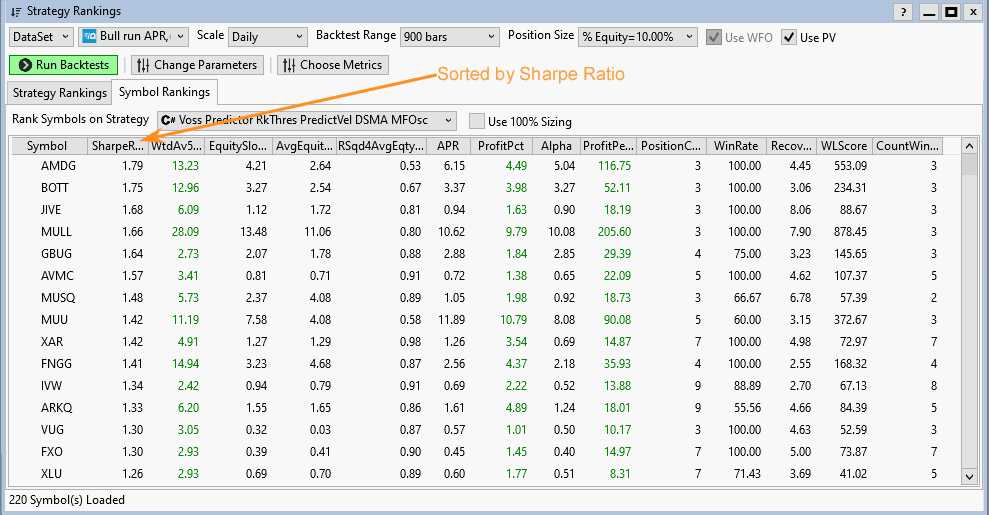
Below are my ETF symbol rankings (on a Daily scale) sorted by Sharpe Ratio. Some of the ScoreCard metrics are from a custom ScoreCard implementation (e.g. WtdAv5ProfitPct), but many are from the Basic ScoreCard.
Thanks. Let me see what I can put together here to send over. This used to work just fine but...
What I have found is that some of my strategies produce metrics properly, and some do not . Samples provided below of each variety. Blocks are not dramatically different between the two as far as I can discern.
The metrics are different for the same run in the Strategy window?
We'll need that strategy code to see what's going on.
We'll need that strategy code to see what's going on.
They are blocks. I'm a novice to these .png files.
See what I mean
QUOTE:
We'll need that strategy code to see what's going on.
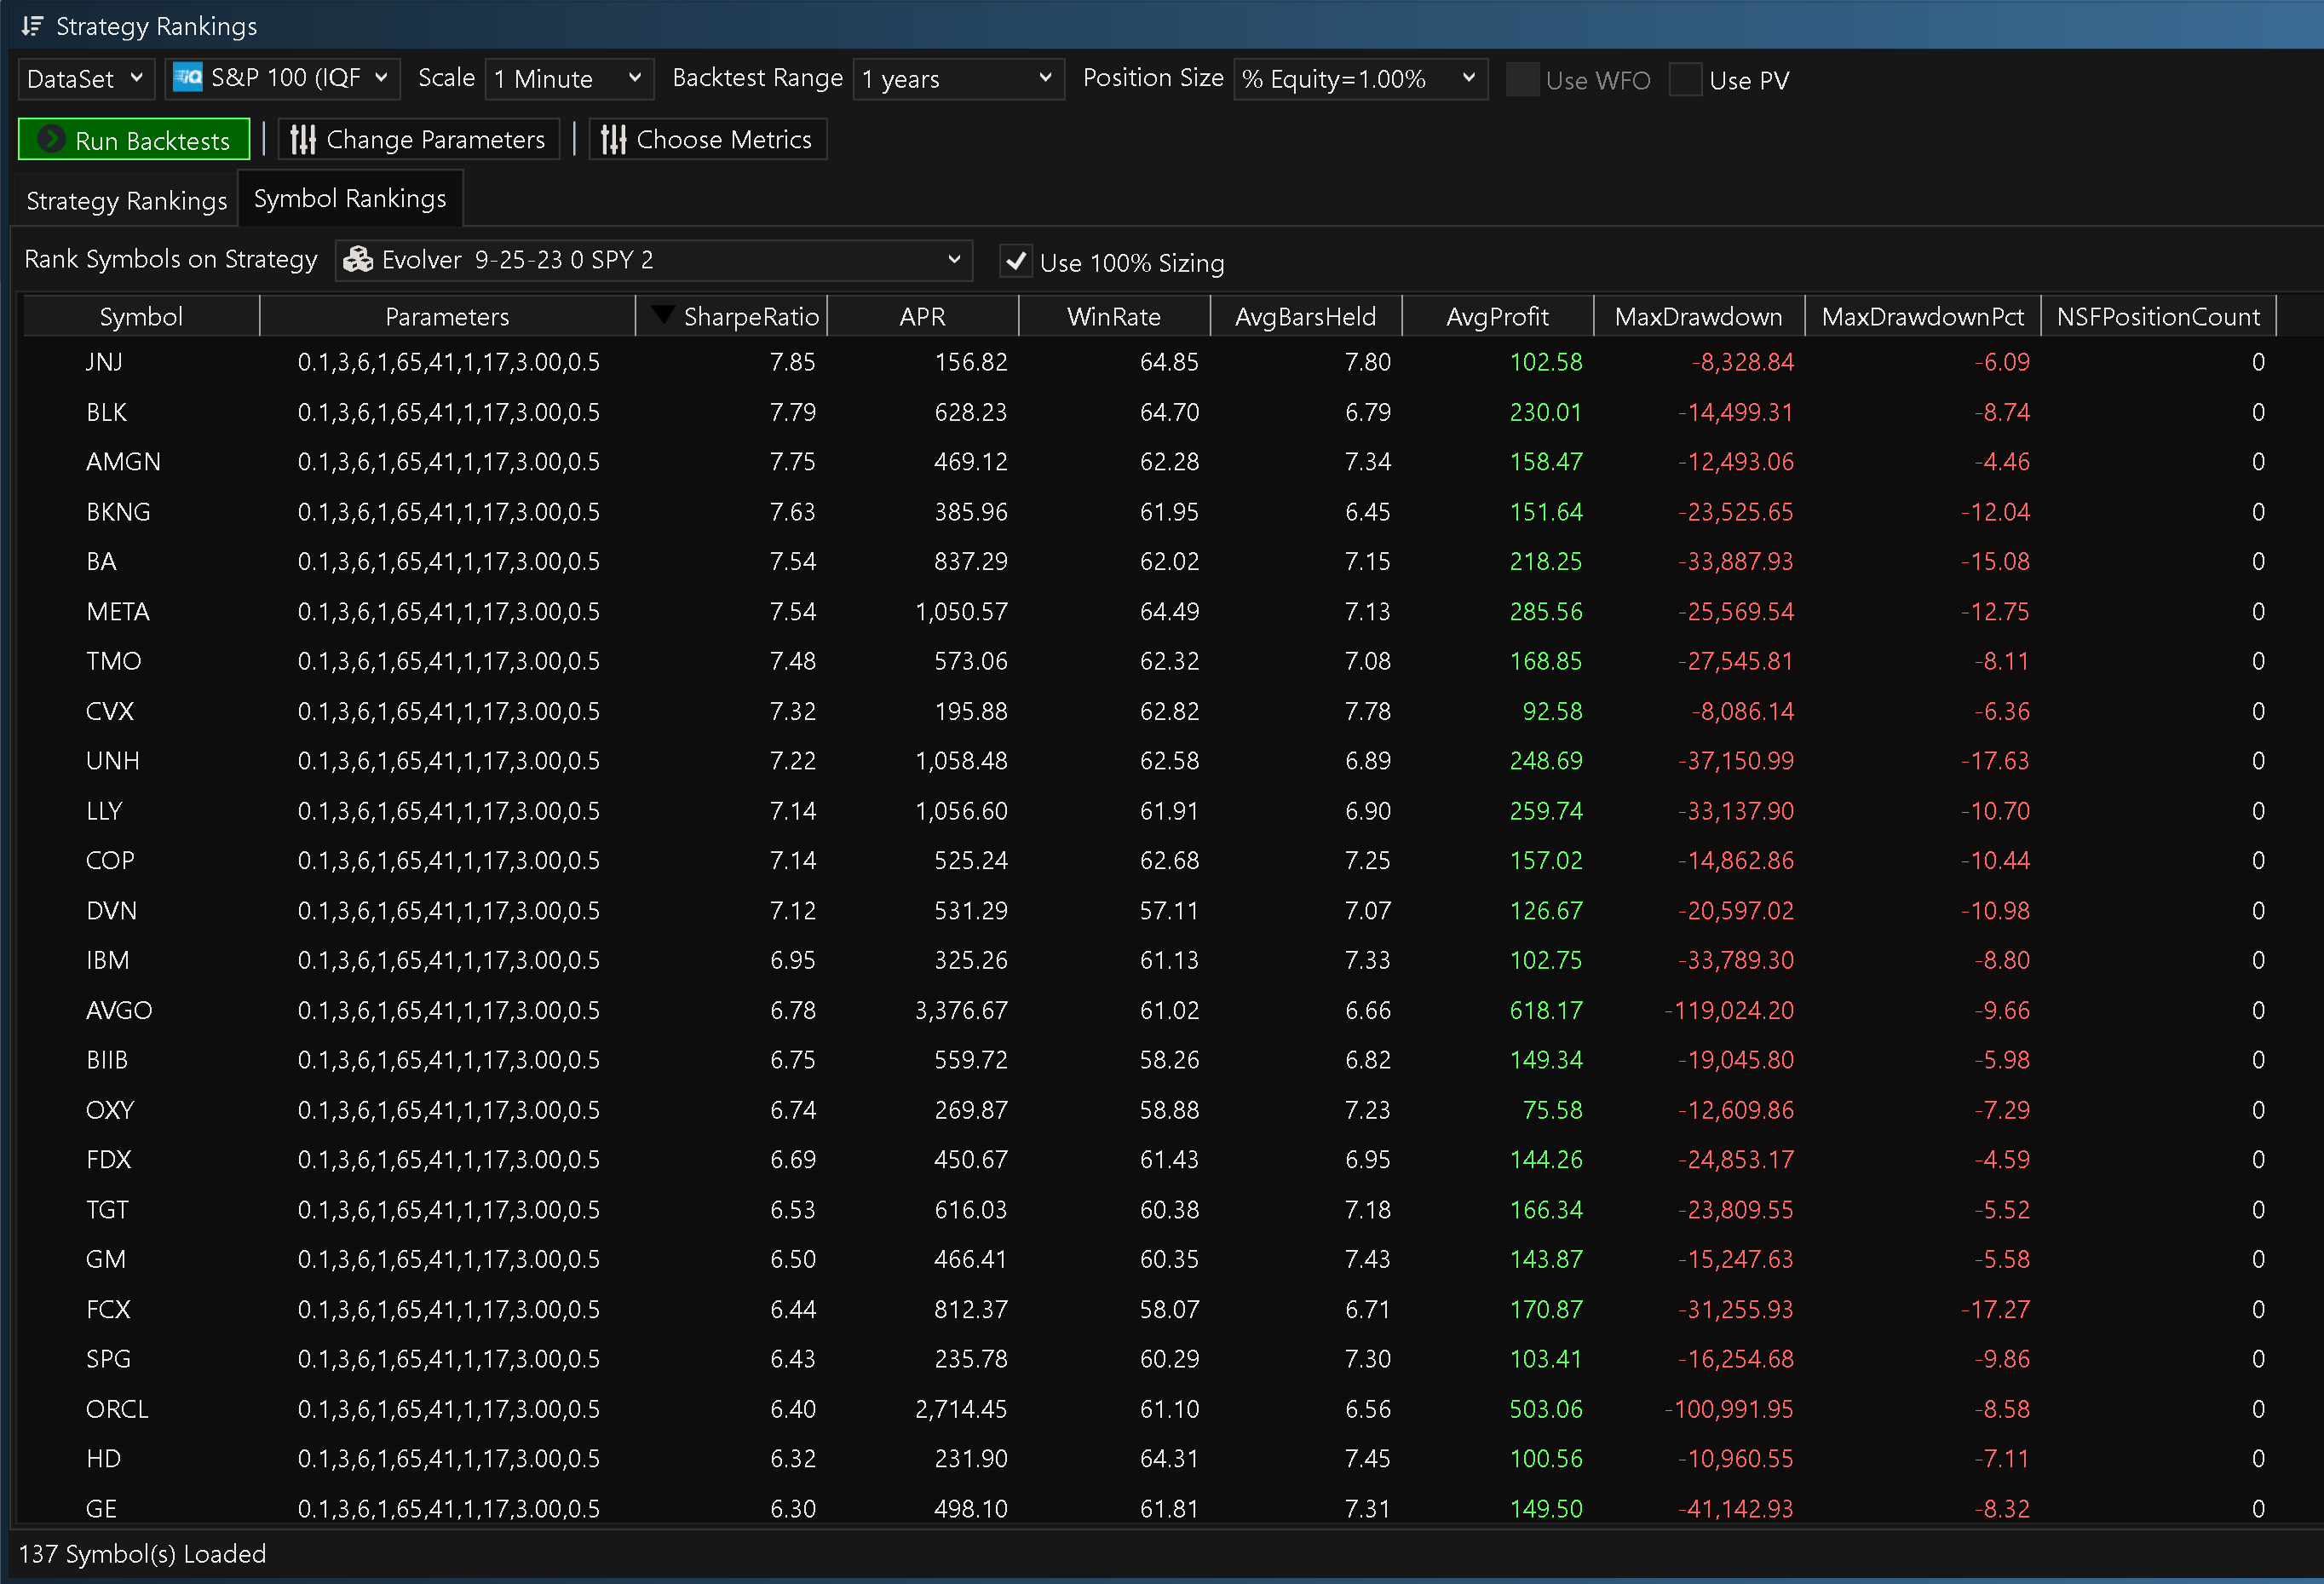
I totally agree. This isn't a problem with the Symbol Rankings, but rather a problem with the strategies themselves. Looking at Post #4, how on earth are you getting Sharpe Ratios in the 7.0s with only a win rate of 60%? Can you include a PositionCount column in that screenshot so we can see how many positions (trades) are returning a Sharpe Ratio in the 7.0s? (A Sharpe Ratio above 2.5 would be highly unusual.)
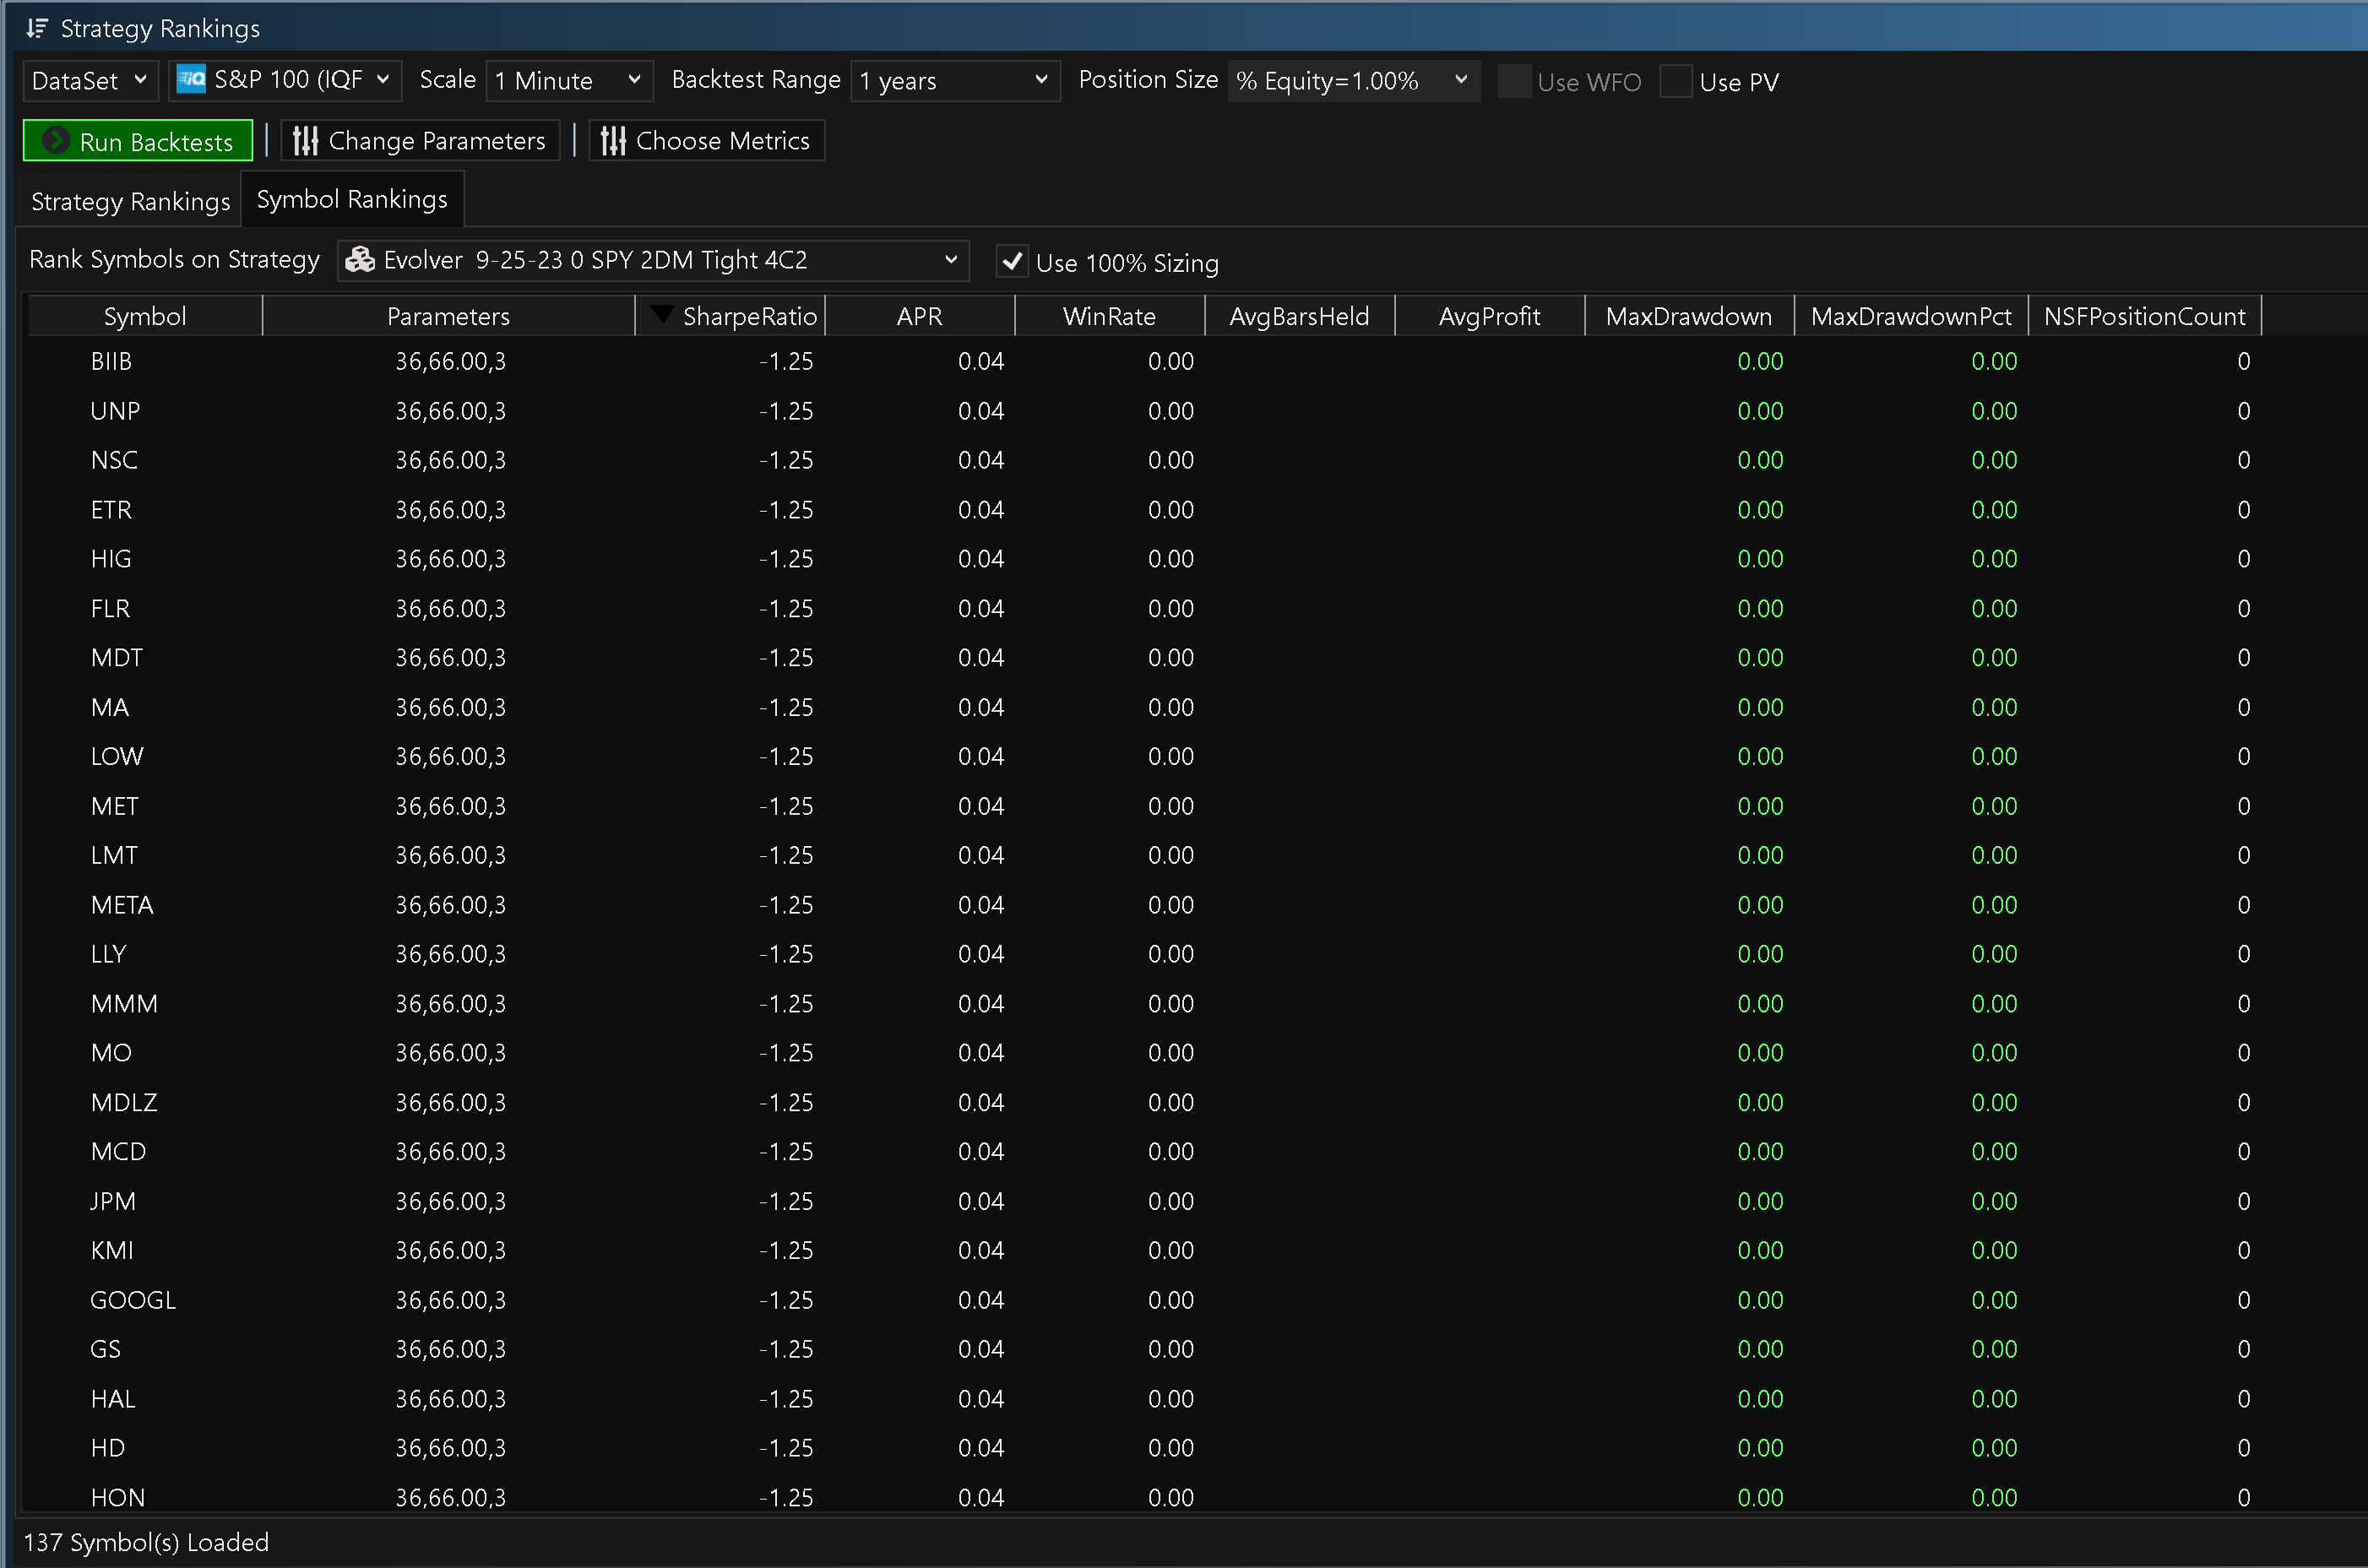
Looking at Post #8, I would say this strategy isn't trading hardly at all. Again, you need to include a PositionCount column in that screenshot as well.
This is a problem with the strategies themselves. They aren't trading right to generate sane ScoreCard metrics (such as Sharpe Ratio) in the first place. Look at how the individual stocks are trading on their Chart to figure out what's wrong with the strategies themselves. Post a Chart showing us how these stocks are trading with these strategies.
It looks like the strategies didn't take any positions, that's why the metrics are the same for each symbol.
When evaluating ScoreCard metrics, you want them to be based, ideally, on at least 5 positions. In my own custom ScoreCard implementation, I actually have it return NaN for anything less than 3 positions, and that's really stretching it.
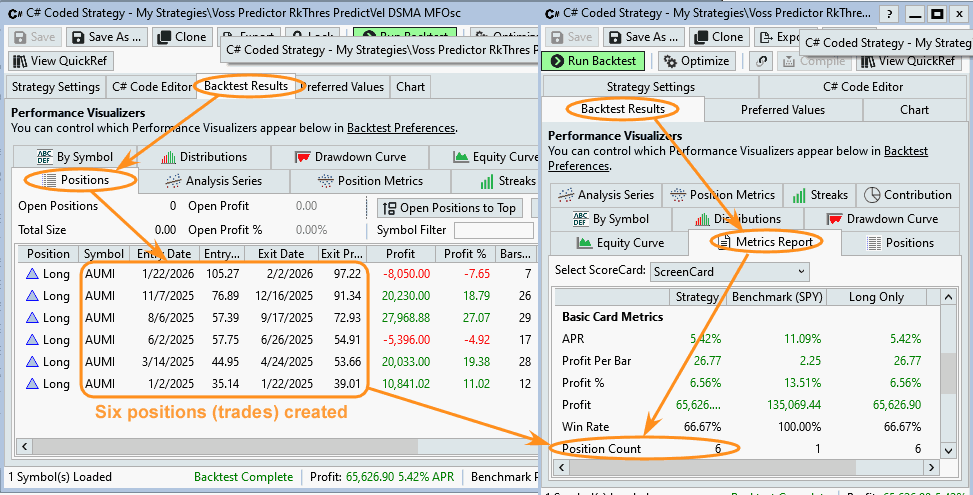
Go through your dataset with your strategies and check to be sure you have enough Data Range to get 5 positions for each individual stock traded. Below, my Voss Predictor strategy has traded AUMI for 6 positions as shown in the Backtest Results tab.
If you're new to WealthLab, I would start with an existing strategy that works, then modify it to suit your own design. It doesn't matter if it's a Block strategy or a code-based strategy. Just pick something that trades.
This one produces lots of signals and positions with $100K Initial $, on 1% positions on the minute. So, I'm doubtful that a lack of positions is the problem.
QUOTE:
This one produces lots of signals and positions ...
That's great! So show us a screenshot of Rank Symbols on Strategy for that particular strategy, but include a PositionCount column in the screenshot so we--including you--can see how many positions each symbol took when computing its ScoreCard metrics.
Post #12 doesn't tell us (or you) how many positions each individual stock took, so it's not answering the salient question. Include the PositionCount column.
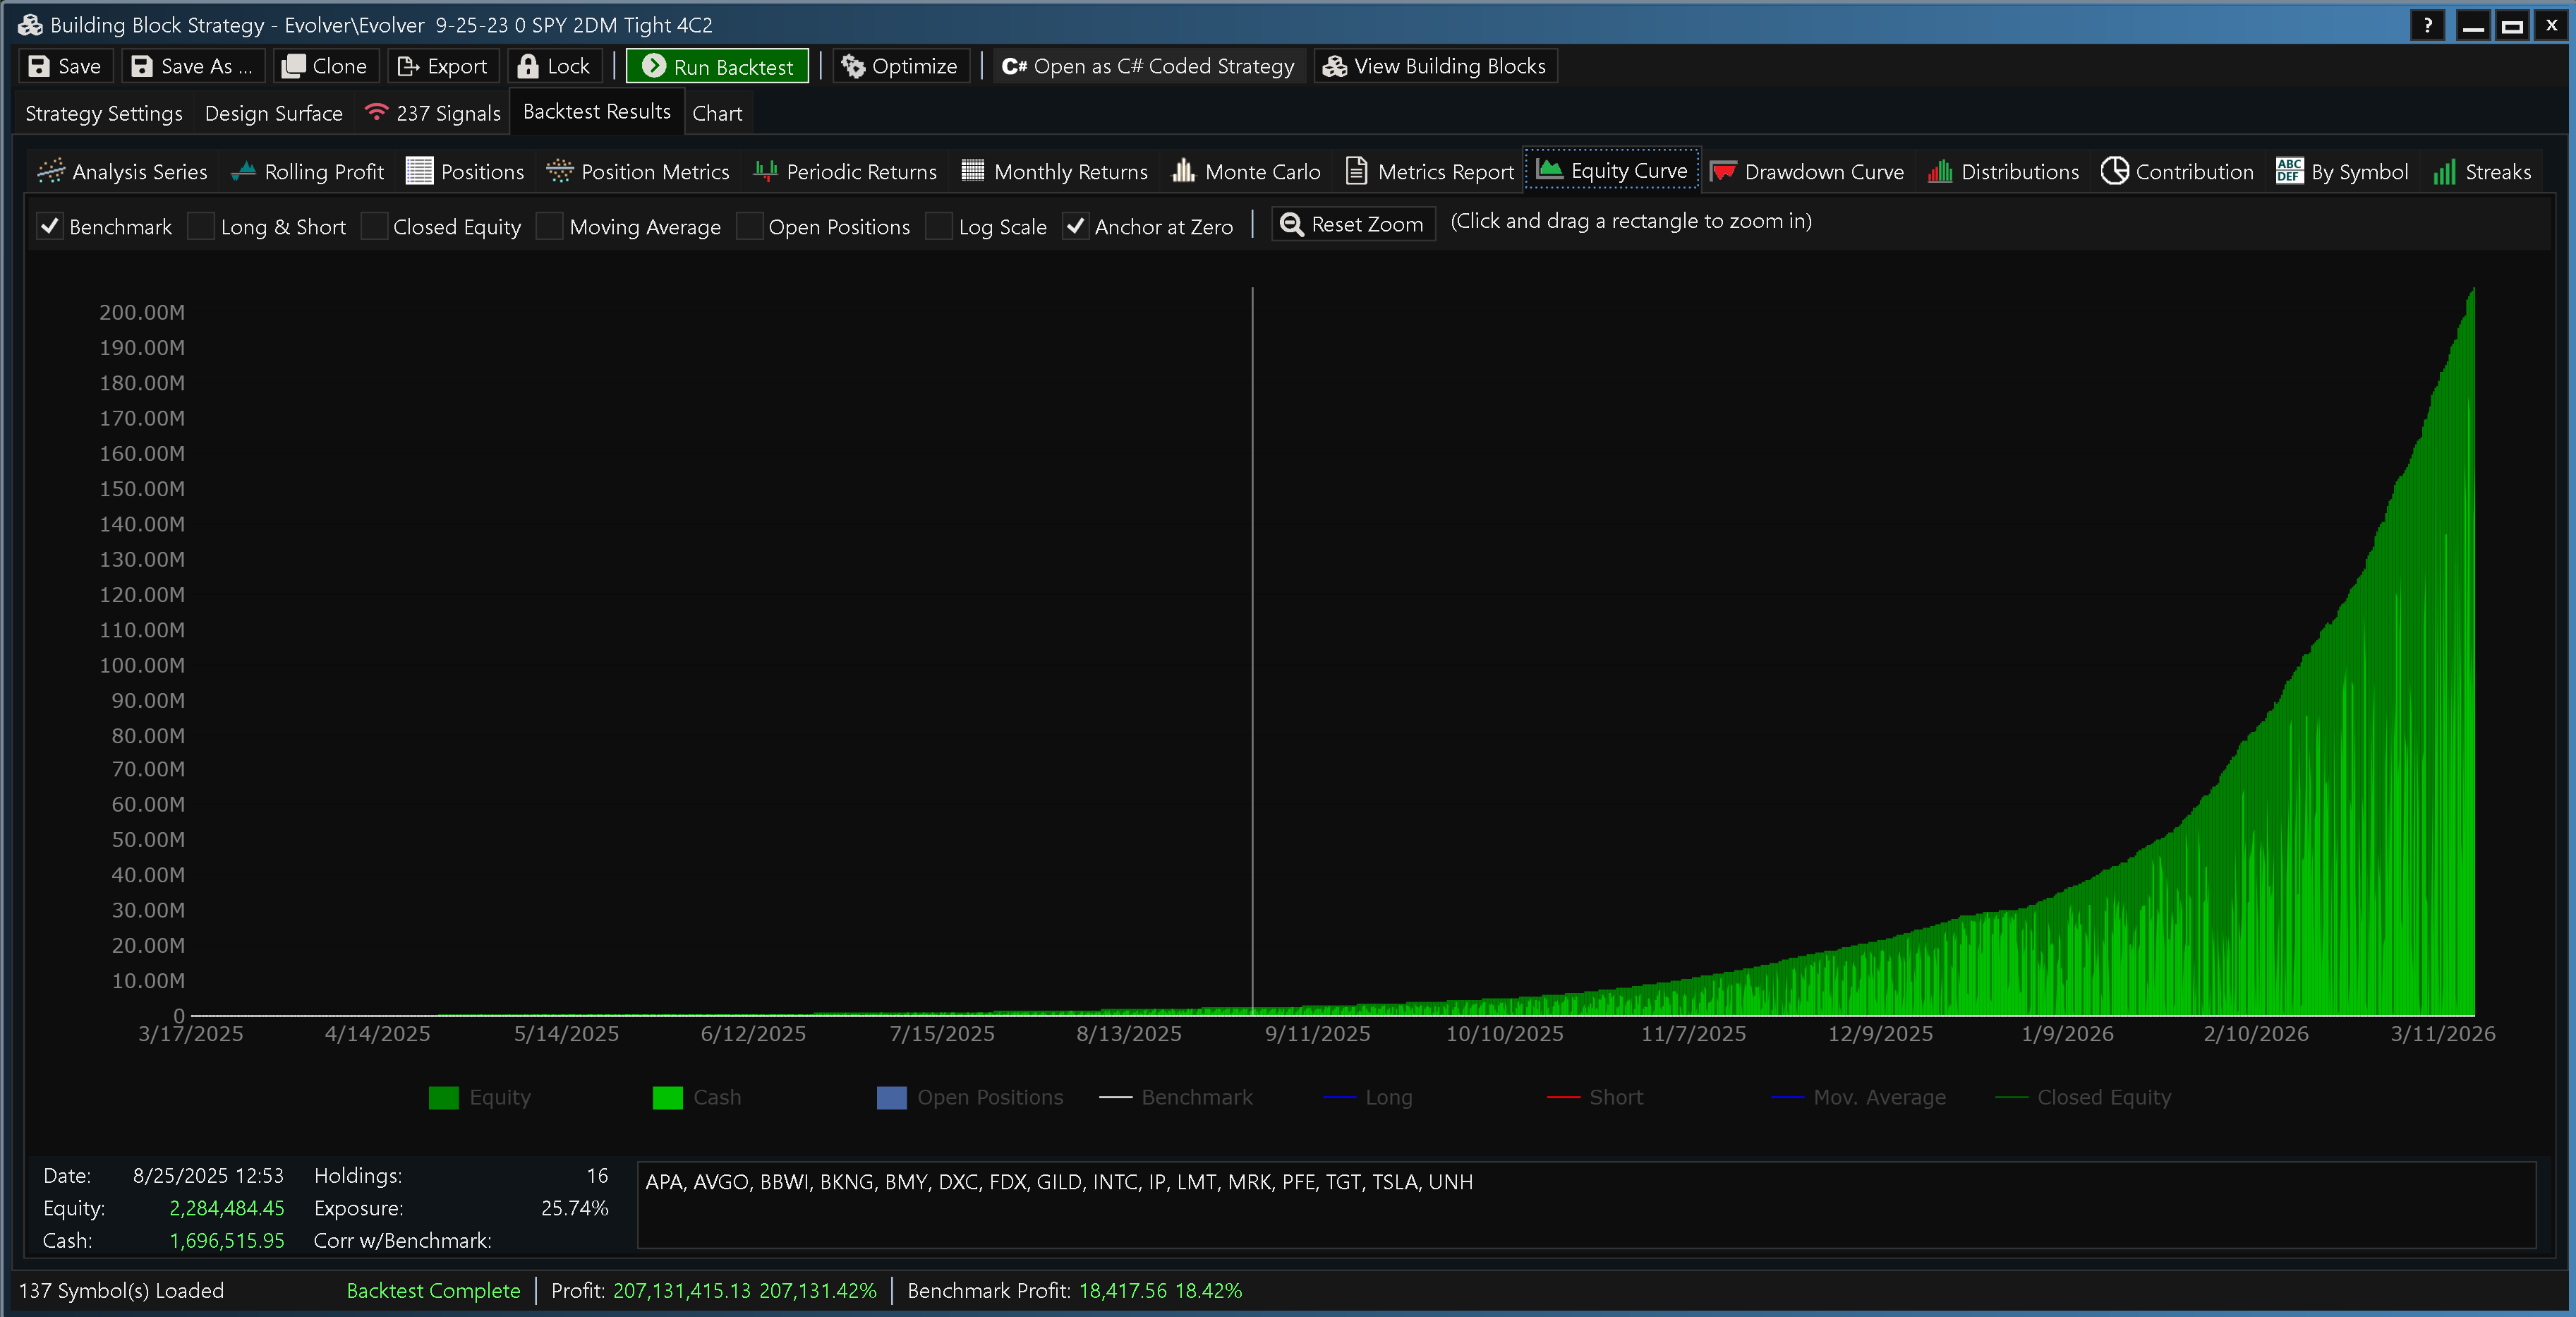
The image of the equity curve in Post #12 is too good, impossible - that strategy must have rules that are peeking. We'd like to know the blocks so that we can help you correct the error.
My guess is that you're using the 1 Bar in Future (1 bar ahead) qualifier in an intended way. It should be applied only to AtClose PowerPack Building Block signals.
My guess is that you're using the 1 Bar in Future (1 bar ahead) qualifier in an intended way. It should be applied only to AtClose PowerPack Building Block signals.
Here is a partial page, does this help? I'm having some trouble shooting a long page so this is only a partial page.
Cone, I:m not using 1 bar in future. I have not quite figured out how/when to use that block yet. I know it sounds like I'm new to WL8, but, I've been an everyday user since WL2, and I'm probably older than 98% of all your users worldwide. It's difficult to keep up with some of the updates and especially some of the tools. WL is an amazing platform, and I run these strats everyday and make decent ROC most days.
I'm aware of peeking as well, and will try to send addl info
Thx
1 Bar in Future is for At-Close orders on the same day. That qualifier should only be used with conditions on At-Close Power Pack blocks.
This last image shows a reference to the peeking indicator - it's Chikou Span.
This last image shows a reference to the peeking indicator - it's Chikou Span.
Yes, Chikou Span is an exit block in this example I have supplied here (along side other exit blocks), but, would a Chikou Span block be the cause of my original issue posed in #3 above?
As for the "1 Bar in Future" ... I never use this
As for the "1 Bar in Future" ... I never use this
Cause? I have no idea because I don't know what's in your strategy other than a peeking indicator.
I removed the Chikou Span block, and reran the backtest. The results are still the same as were shown in #3 above, FYI
QUOTE:
I removed the Chikou Span block,... The results are still the same
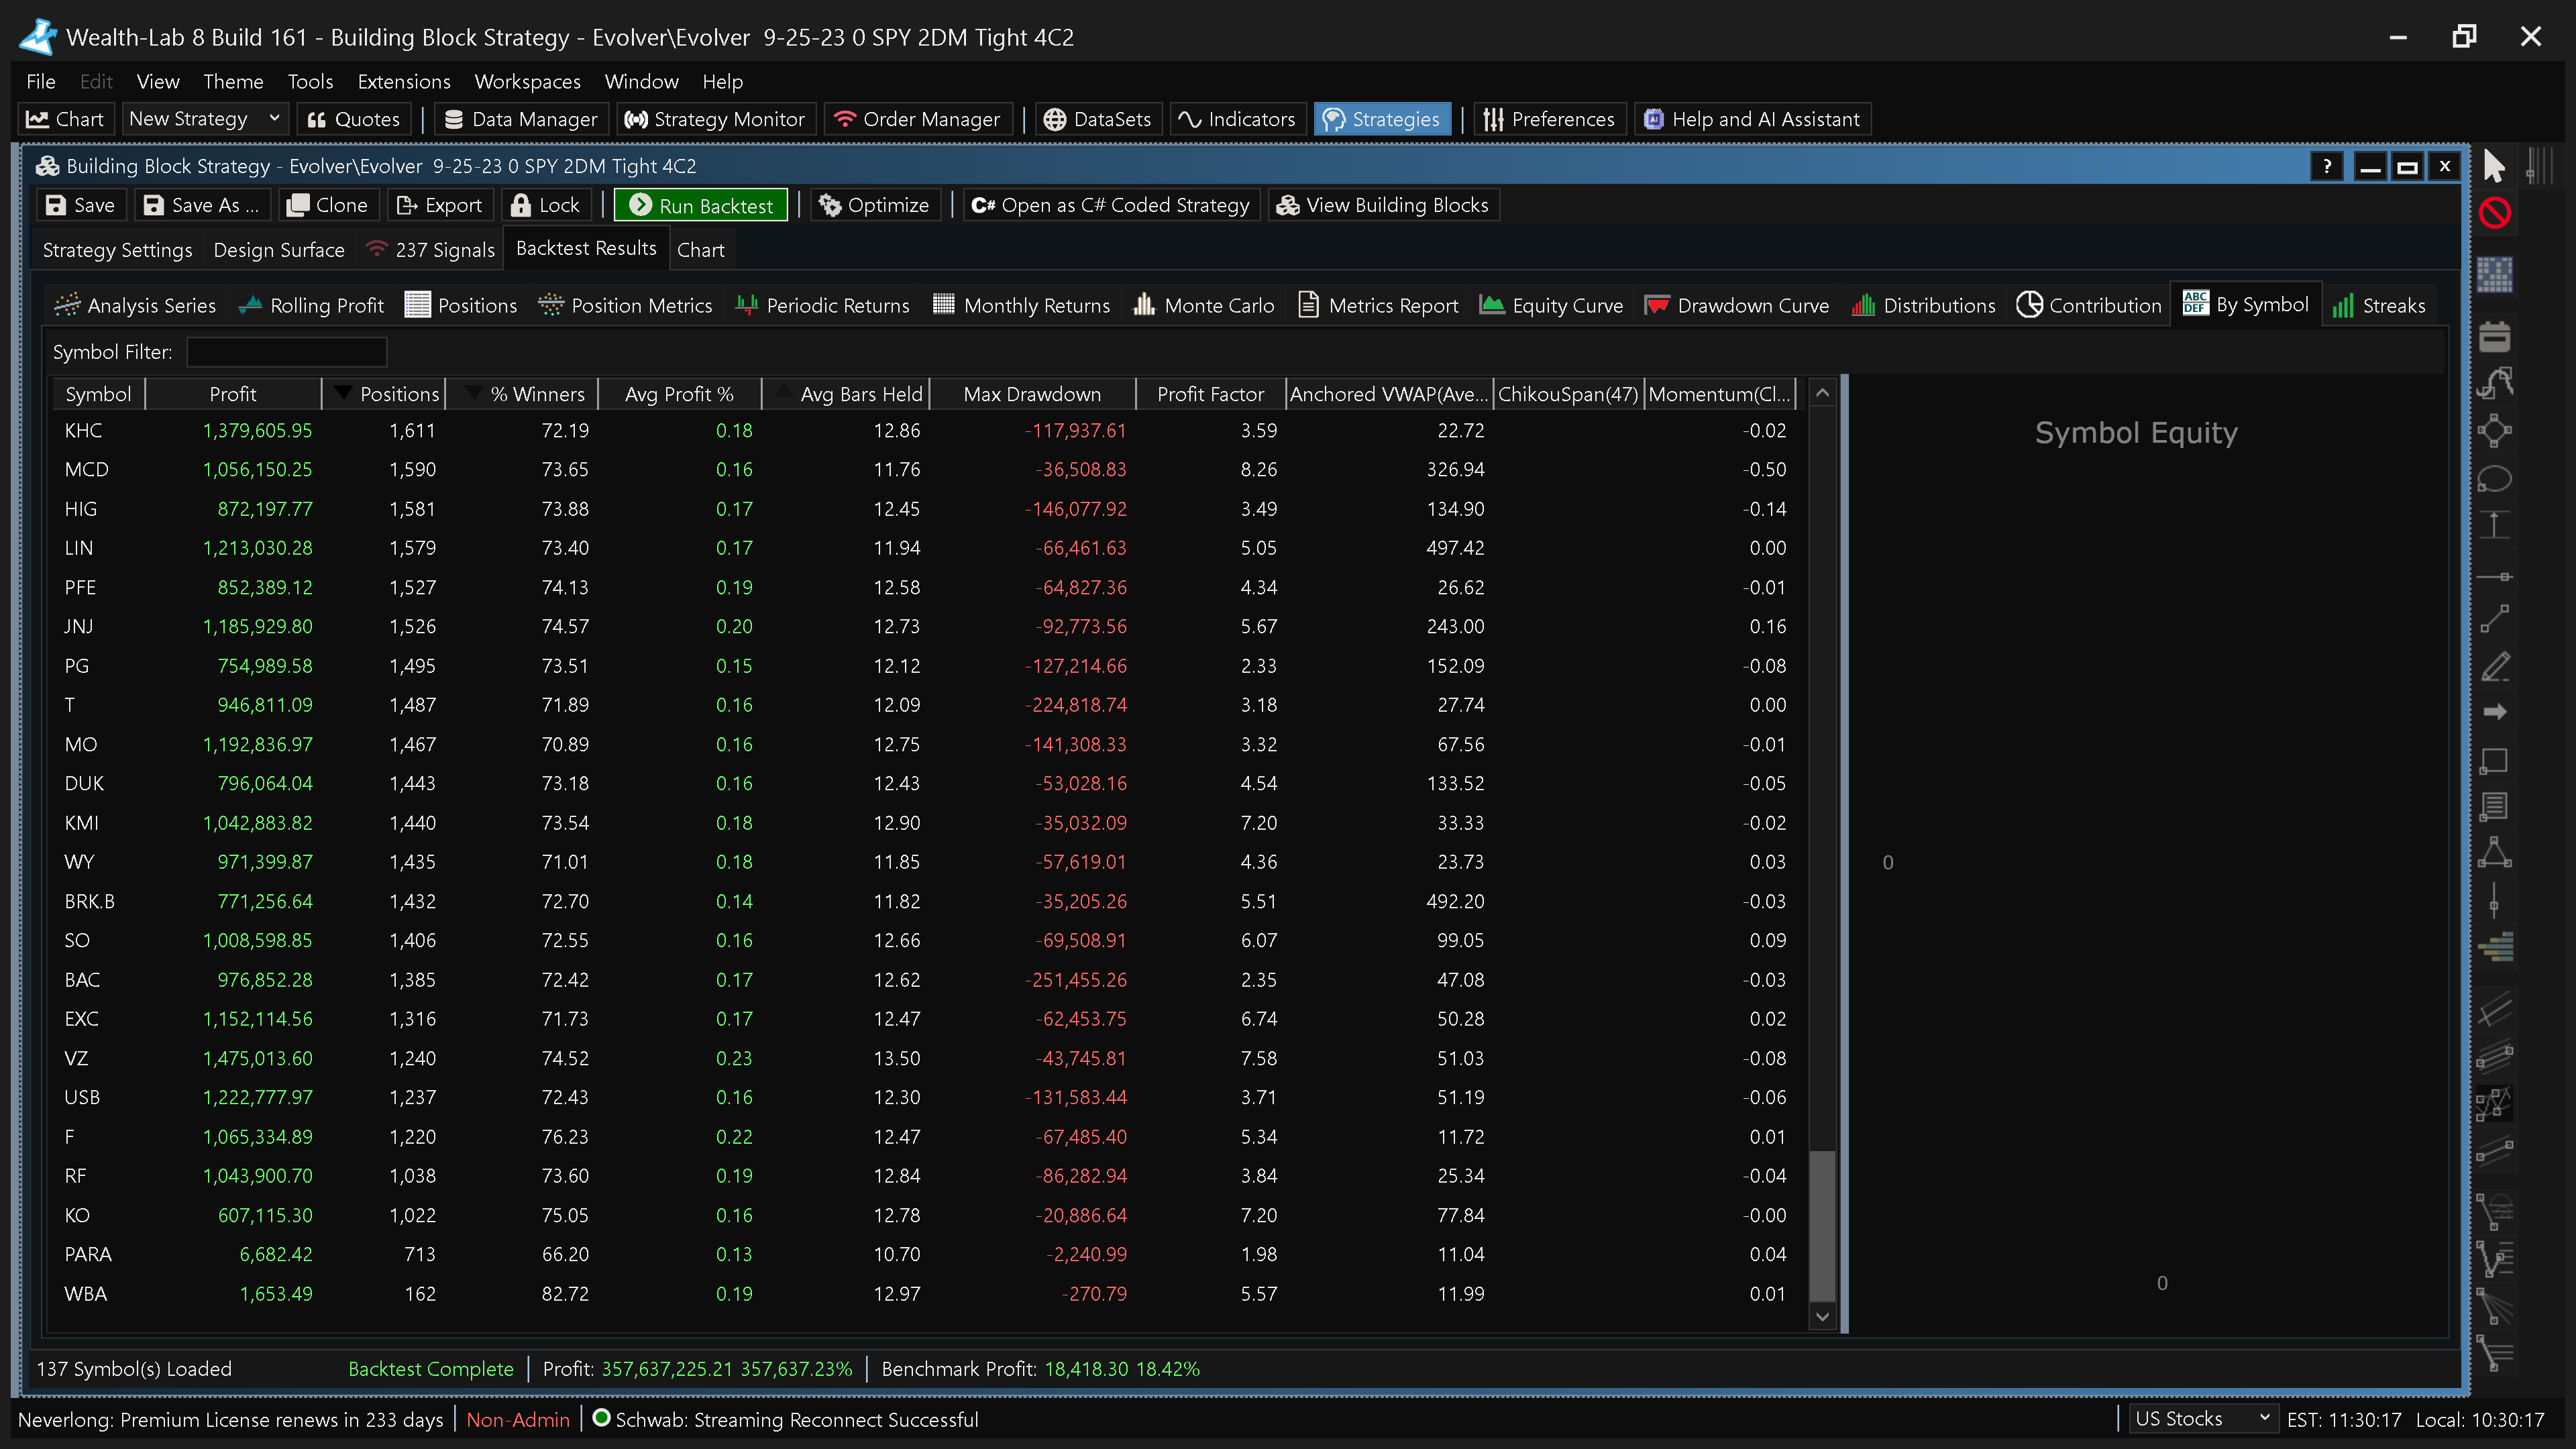
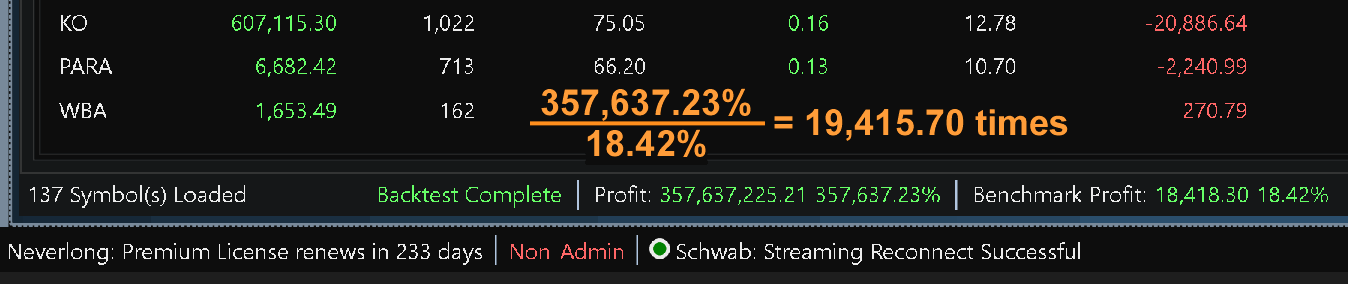
Okay. Is your profit ratio (see screenshot below) still 19,415.70 times the benchmark? Understand, a profit ratio of over 3 times would raise questions. As experienced as you are, you would understand that.
I don't know Blocks, so I'll just sit this one out. The best of luck to you.
Your Response
Post
Edit Post
Login is required