Why the following test strategy give different results when I ran it using a single symbol vs using a dataset with a symbol filter? In addition, using Norgate vs WD Nasdaq 100 data shows different result too.
Strategy setting: most recent 4 years.
1. With a single symbol: position opened on 8/14/2024
2. With WD Nasdaq 100: position opened on 5/29/2026
3. With Norgate Nasdaq 100 Current & Past: No position.
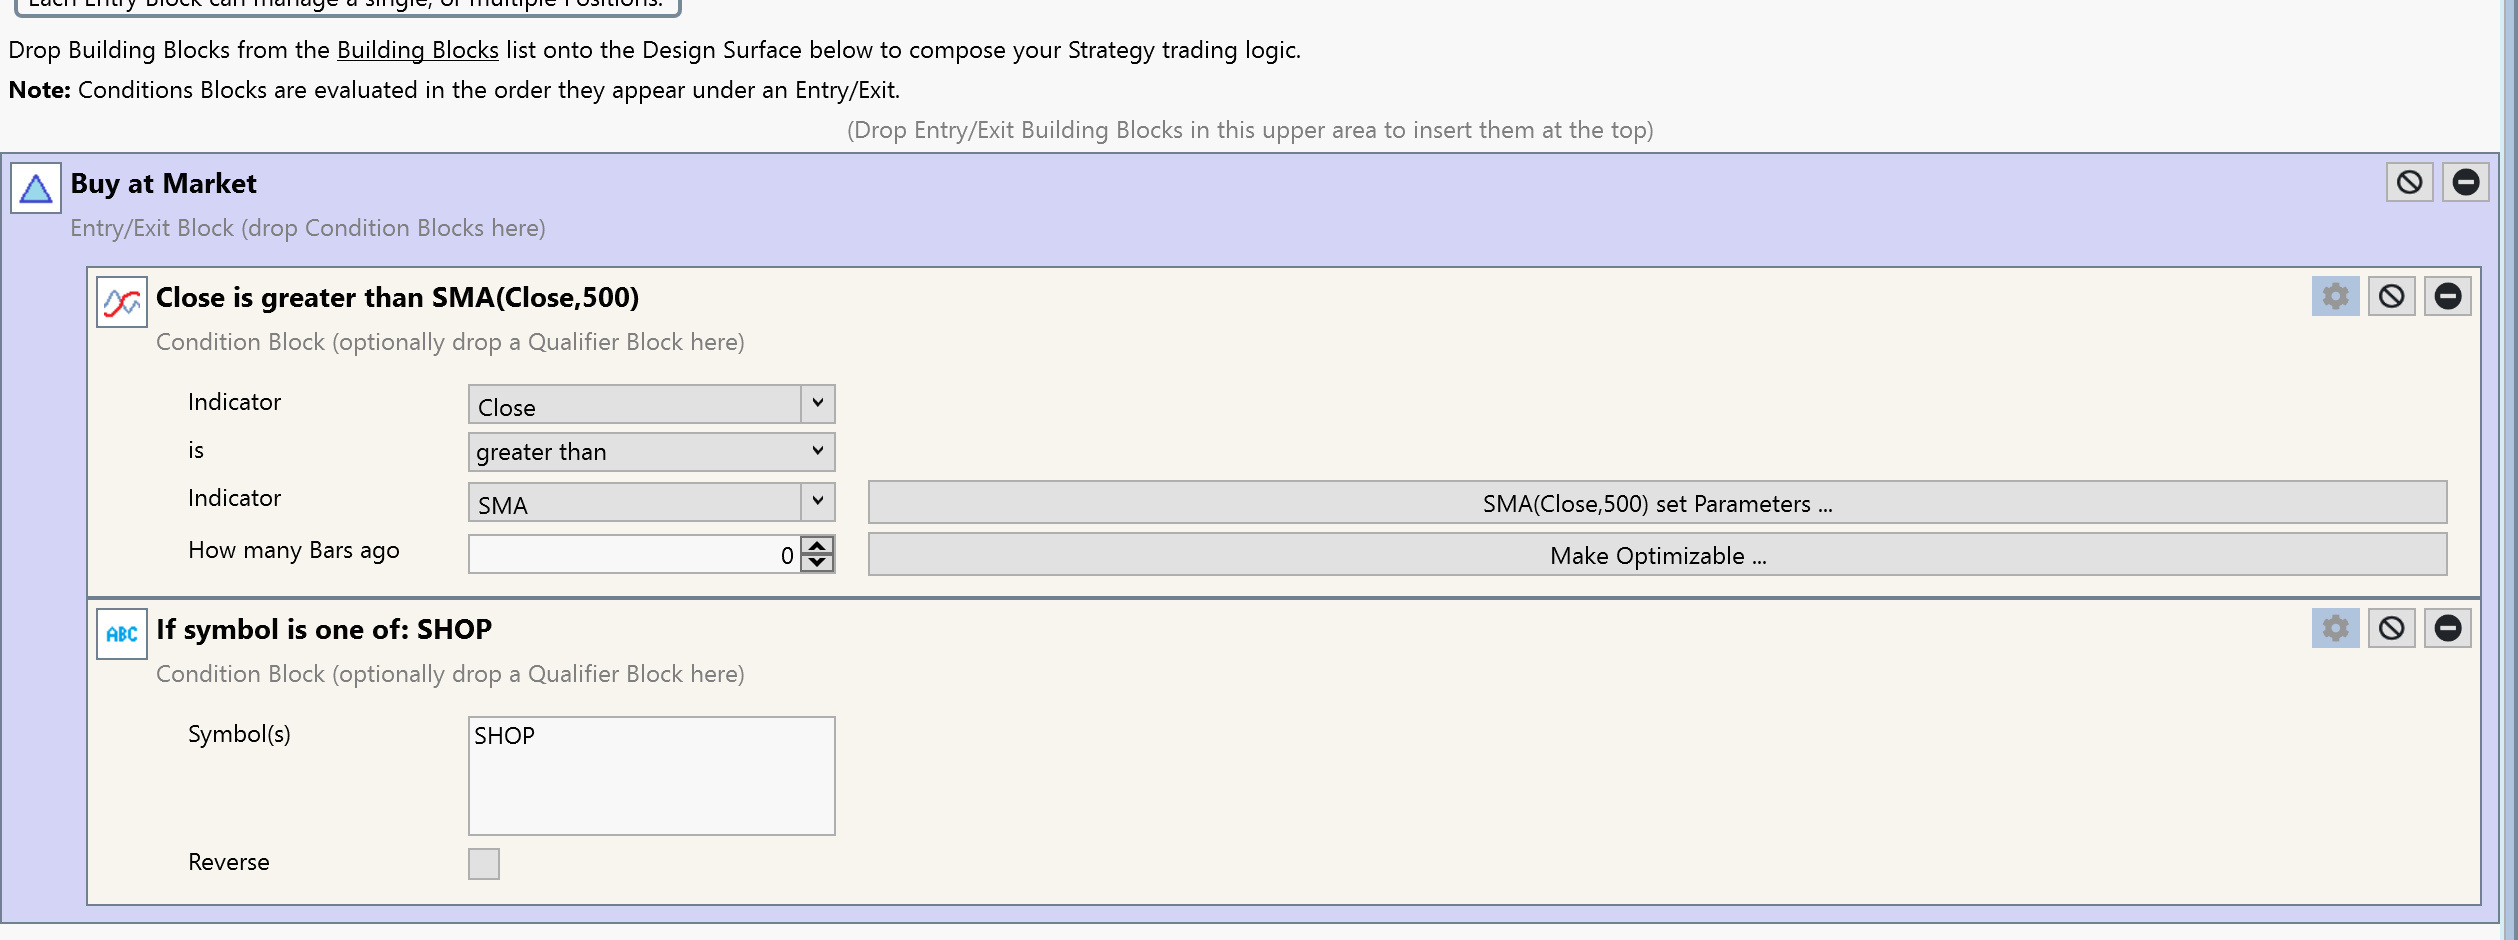
Strategy setting: most recent 4 years.
1. With a single symbol: position opened on 8/14/2024
2. With WD Nasdaq 100: position opened on 5/29/2026
3. With Norgate Nasdaq 100 Current & Past: No position.
Rename
For WD Nasdaq 100, if I use SMA 200, the position is opened on 05/20/2025. If I use SMA 300, the position is opened on 8/4/2025. But when I looked at the chart, SHOP is above all 200/300/500 SMA from 05/12/2025 to 01/29/2026. SHOP joined Nasdaq 100 on 05/19/2025. So my understanding is that in the portfolio mode, it should open the position on 05/20/2025, but seems that this is not the case and the entry date changes based on the SMA period. Why does this happen?
QUOTE:
if I use SMA 200, the position is opened on 05/20/2025. If I use SMA 300, the position is opened on 8/4/2025
I guess the cause may be the same as in this post, related to the number of “seed data” bars.
https://www.wealth-lab.com/Discussion/Norgate-Current-amp-Past-DataSets-Have-Wrong-Bar-Count-13140
What @johnbens said + Data Range loaded.
The first trade of a block strategy strategy is delayed for the number of bars of the longest indicator period. For example, if that period is 250 and the data load starts on 1/2/2020, then the first trade won't occur until at least 1/2/2021.
The first trade of a block strategy strategy is delayed for the number of bars of the longest indicator period. For example, if that period is 250 and the data load starts on 1/2/2020, then the first trade won't occur until at least 1/2/2021.
@cone but I used latest 4 years data which goes back to 2022 so it should not matter for a trade in 2025?
Then it's a case of NSF Positions.
Make the Position sizing 1% with 2:1 margin (or just $5,000 fixed with Starting Capital $500K) and you'll be sure to get that trade on the first date possible.
Make the Position sizing 1% with 2:1 margin (or just $5,000 fixed with Starting Capital $500K) and you'll be sure to get that trade on the first date possible.
@Cone sorry I forgot to mention I used the default $5000 fixed amount in the test. You can try to test yourself.
I think the problem is related to what's mentioned in the about thread. But seems the seed period is calculated from the start of the membership date, not the start date one specified in the backtest window. That means if one uses some indicators with period larger than the seed window length, the stock does not show up in the tradable universe until
If the above is what's happening, it's a bug IMO:
1. It does not make sense to me that some fixed constant forced by the software/extension overrides what the strategy is meant to do: if the strategy is designed to buy Nasdaq 100 stocks above their SMA 500, a stock above its SMA 500 on its first membership day should be a valid candidate. If someone wants the current behavior in WL, they can add extra conditions to enforce it.
2. It also introduces inconsistent result b/w data providers if they use different seed window length. e.g. WD 365 vs Norgate 200 give different result.
I think the problem is related to what's mentioned in the about thread. But seems the seed period is calculated from the start of the membership date, not the start date one specified in the backtest window. That means if one uses some indicators with period larger than the seed window length, the stock does not show up in the tradable universe until
CODE:days after the membership date.
startIndex-seed window length
If the above is what's happening, it's a bug IMO:
1. It does not make sense to me that some fixed constant forced by the software/extension overrides what the strategy is meant to do: if the strategy is designed to buy Nasdaq 100 stocks above their SMA 500, a stock above its SMA 500 on its first membership day should be a valid candidate. If someone wants the current behavior in WL, they can add extra conditions to enforce it.
2. It also introduces inconsistent result b/w data providers if they use different seed window length. e.g. WD 365 vs Norgate 200 give different result.
We appreciate your feedback and will consider improving this in a future release.
Re: $5000 fixed amount in the test.
And Starting Capital?
You'd need $500K to be sure in case all 100 symbols were above the long-term average.
But, you're right. The 200-bar seed w.r.t. to entering the Nasdaq 100 is insufficient for the 500 dma.
w.r.t. to improving this in a future release...
Personally, whenever I program almost any daily indicator, I load All Data with GetHistoryUnsynched, calculate and then synchronize the indicator, which will then be available on bar 0 - assuming the test data range starts after the indicator period. It could be a pattern that blocks use in the future.
And Starting Capital?
You'd need $500K to be sure in case all 100 symbols were above the long-term average.
But, you're right. The 200-bar seed w.r.t. to entering the Nasdaq 100 is insufficient for the 500 dma.
w.r.t. to improving this in a future release...
Personally, whenever I program almost any daily indicator, I load All Data with GetHistoryUnsynched, calculate and then synchronize the indicator, which will then be available on bar 0 - assuming the test data range starts after the indicator period. It could be a pattern that blocks use in the future.
QUOTE:
Personally, whenever I program almost any daily indicator, I load All Data with GetHistoryUnsynched, calculate and then synchronize the indicator,
How do you do this? the Initialize method already offers the bar history which is clipped. Do you reload for the same ticker?
For example, export the blocks to C# and make this change -
CODE:
// replace this statement
indicator2 = new SMA(bars.Close,500);

// with these:
indicator2 = new SMA(GetHistoryUnsynched(bars.Symbol, bars.Scale, null).Close, 500);
indicator2.AssumeValuesOf(TimeSeriesSynchronizer.Synchronize(indicator2, bars));
Let me see if I got this right. Correct me if I'm wrong.
You are using GetHistoryUnsynched because you want to avoid using previously cached data by the Data Manager since it is incomplete at the beginning of this external time series. (Since cached data isn't being employed, this operation is slow.)
Next, you want to synchronize the result anyway so the bars of this unsynched data will now line up with the TimeSeries under test (employed by Initialize) so both time series can be plotted on the same Chart and analyzed together.
We really need a tutorial explaining all these steps, but for something like this, I would place this explanation back in the appendix of the tutorial, which means I would never see it. :(
You are using GetHistoryUnsynched because you want to avoid using previously cached data by the Data Manager since it is incomplete at the beginning of this external time series. (Since cached data isn't being employed, this operation is slow.)
Next, you want to synchronize the result anyway so the bars of this unsynched data will now line up with the TimeSeries under test (employed by Initialize) so both time series can be plotted on the same Chart and analyzed together.
We really need a tutorial explaining all these steps, but for something like this, I would place this explanation back in the appendix of the tutorial, which means I would never see it. :(
It's a pretty common operation:
1. Load all available bars with GetHistoryUnsynched(). See QuickRef.
2. Create your indicators with it.
3. Synchronize to the charted bars.
The only "trick" (if you can even call it that) is to re-assign the synch'd TimeSeries to the indicator reference, otherwise you'd have to deal with another TimeSeries reference, which is the result of TimeSeriesSynchronizer.Synchronize();
1. Load all available bars with GetHistoryUnsynched(). See QuickRef.
2. Create your indicators with it.
3. Synchronize to the charted bars.
The only "trick" (if you can even call it that) is to re-assign the synch'd TimeSeries to the indicator reference, otherwise you'd have to deal with another TimeSeries reference, which is the result of TimeSeriesSynchronizer.Synchronize();
@Cone does that incur a lot of overhead and slow down backtesting, especially for large universe?
Each symbol's run requests its full bar history, so sure, that would slow down a backtest somewhat.
Your Response
Post
Edit Post
Login is required