In a recent post (see https://www.wealth-lab.com/Discussion/Do-Stocks-Outperform-Treasury-Bills-13029) I showed a plot "#Symbols vs. CAGR".
If you want to see that plot for
* another DataSet
* another benchmark
* another Data Range
You can generate such a plot yourself with WealthLab and the finantic.InteractiveGraphics extension.
In this thread I am going to explain in detail how such a plot is generated.
Step 1: Open Extensions->PlotComposer. Select "Histogram" as the Plot Type.
In the "Design" tab, select "Labels" and specify meaningfull texts for "Title", "X-Axis Label and "Y-Axis Label".
At this stage the window should look like this:
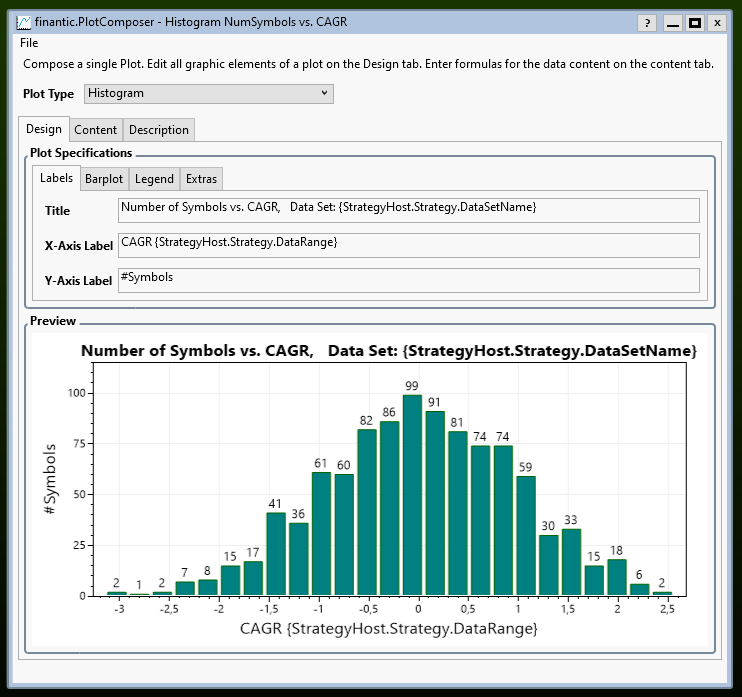
Please note how the title reflects the current DataSet. This is done by including the magic pattern
If you want to see that plot for
* another DataSet
* another benchmark
* another Data Range
You can generate such a plot yourself with WealthLab and the finantic.InteractiveGraphics extension.
In this thread I am going to explain in detail how such a plot is generated.
Step 1: Open Extensions->PlotComposer. Select "Histogram" as the Plot Type.
In the "Design" tab, select "Labels" and specify meaningfull texts for "Title", "X-Axis Label and "Y-Axis Label".
At this stage the window should look like this:
Please note how the title reflects the current DataSet. This is done by including the magic pattern
CODE:
{StrategyHost.Strategy.DataSetName}
Rename
Step2: Content of Plot
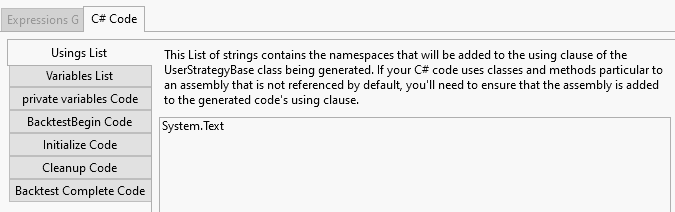
In the "Content" tab we open "C# Code. (While Interactive Graphics can genrate simpler graphics without coding, the plot at hand is more complex and needs some C# coding.
We are going to use a StringBuilder, so we need "System.Text" in "Usings List:
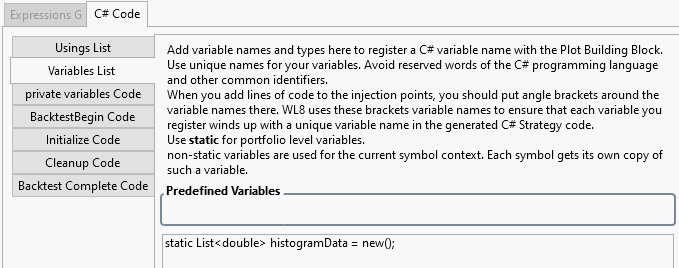
We collect our histogram data in a List that is decared in the "Variables List":
In the "Content" tab we open "C# Code. (While Interactive Graphics can genrate simpler graphics without coding, the plot at hand is more complex and needs some C# coding.
We are going to use a StringBuilder, so we need "System.Text" in "Usings List:
We collect our histogram data in a List that is decared in the "Variables List":
Calculation of CAGR
All these BarHistories have varying start and end dates, so we can't use an Indicator for the CAGR calculation. Instead we use a helper routine that accepts dates and prices:
(see https://en.wikipedia.org/wiki/Compound_annual_growth_rate for the calculation details)
We are going to calculate CAGR for BarHistories and use another helper to make things simpler:
Both routines go to the "private variables Code" section:
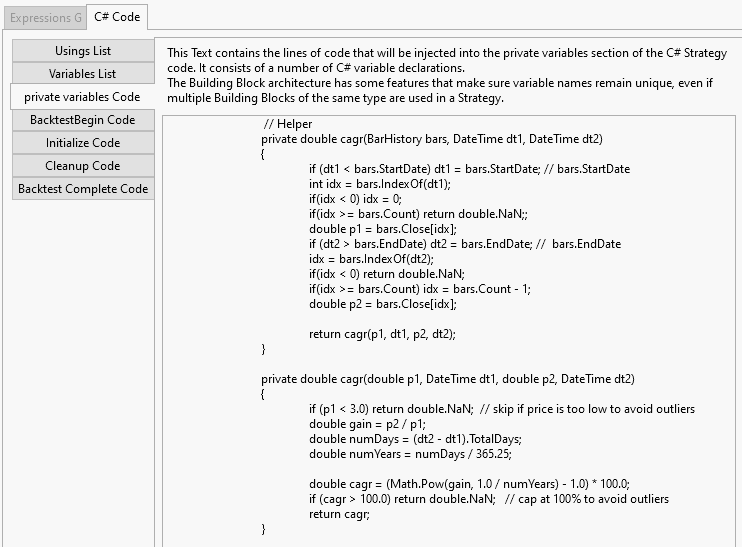
All these BarHistories have varying start and end dates, so we can't use an Indicator for the CAGR calculation. Instead we use a helper routine that accepts dates and prices:
CODE:
      private double cagr(double p1, DateTime dt1, double p2, DateTime dt2)
      {
         if (p1 < 3.0) return double.NaN;  // skip if price is too low to avoid outliers
         double gain = p2 / p1;
         double numDays = (dt2 - dt1).TotalDays;
         double numYears = numDays / 365.25;

         double cagr = (Math.Pow(gain, 1.0 / numYears) - 1.0) * 100.0;
         if (cagr > 100.0) return double.NaN;   // cap at 100% to avoid outliers
         return cagr;
      }
(see https://en.wikipedia.org/wiki/Compound_annual_growth_rate for the calculation details)
We are going to calculate CAGR for BarHistories and use another helper to make things simpler:
CODE:
      private double cagr(BarHistory bars, DateTime dt1, DateTime dt2)
      {
         if (dt1 < bars.StartDate) dt1 = bars.StartDate; // bars.StartDate
         int idx = bars.IndexOf(dt1);
         if(idx < 0) idx = 0;
         if(idx >= bars.Count) return double.NaN;;
         double p1 = bars.Close[idx];
         if (dt2 > bars.EndDate) dt2 = bars.EndDate; //  bars.EndDate
         idx = bars.IndexOf(dt2);
         if(idx < 0) return double.NaN;
         if(idx >= bars.Count) idx = bars.Count - 1;
         double p2 = bars.Close[idx];

         return cagr(p1, dt1, p2, dt2);
      }
Both routines go to the "private variables Code" section:
With the calculation routines in place we can actually calculate and collect the CAGR values for each symbol. The code for that goes to the "Initialize Code" section:
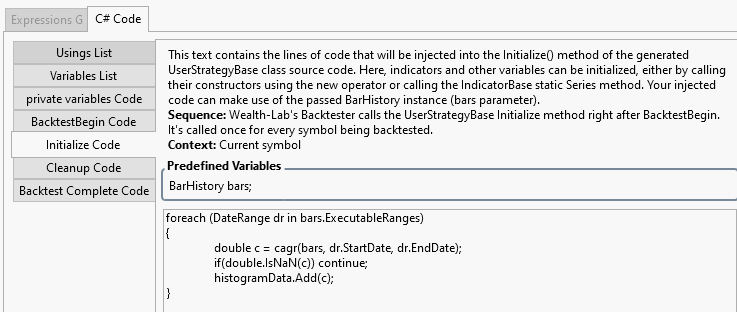
Here is the code:
Please note: The individual CAGR values are collected in the histogramdata list.
Here is the code:
CODE:
foreach (DateRange dr in bars.ExecutableRanges)
{
   double c = cagr(bars, dr.StartDate, dr.EndDate);
    if(double.IsNaN(c)) continue;
   histogramData.Add(c);
}
Please note: The individual CAGR values are collected in the histogramdata list.
Finally we can create the histogram plot:
We want to show the CAGR of the benchmark symbol. This is calculated with the following code:
In order to make the plot more understandable we add some vertical lines and annotations:
The latter code snippets go to the "Backtest Complete Code" section:
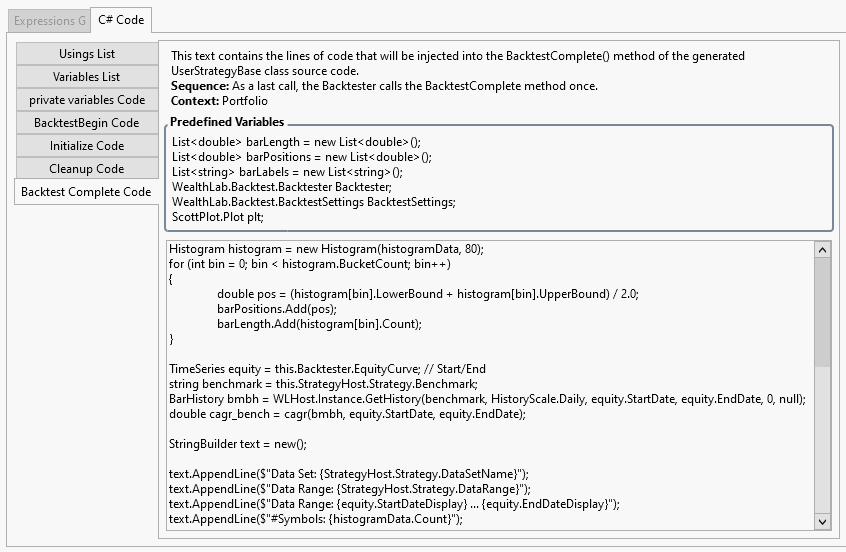
At this stage the generation of the plot is complete. We save everything to a "PlotSpec" using the File->Save Plot Specs action.
CODE:
Histogram histogram = new Histogram(histogramData, 80);
for (int bin = 0; bin < histogram.BucketCount; bin++)
{
   double pos = (histogram[bin].LowerBound + histogram[bin].UpperBound) / 2.0;
   barPositions.Add(pos);
   barLength.Add(histogram[bin].Count);
}
We want to show the CAGR of the benchmark symbol. This is calculated with the following code:
CODE:
TimeSeries equity = this.Backtester.EquityCurve; // Start/End
string benchmark = this.StrategyHost.Strategy.Benchmark;
BarHistory bmbh = WLHost.Instance.GetHistory(benchmark, HistoryScale.Daily, equity.StartDate, equity.EndDate, 0, null);
double cagr_bench = cagr(bmbh, equity.StartDate, equity.EndDate);
In order to make the plot more understandable we add some vertical lines and annotations:
CODE:
StringBuilder text = new();

text.AppendLine($"Data Set: {StrategyHost.Strategy.DataSetName}");
text.AppendLine($"Data Range: {StrategyHost.Strategy.DataRange}");
text.AppendLine($"Data Range: {equity.StartDateDisplay} ... {equity.EndDateDisplay}");
text.AppendLine($"#Symbols: {histogramData.Count}");

// Mean
double mean = histogramData.Mean();
plt.AddVerticalLine(mean , Color.Blue,  2, ScottPlot.LineStyle.Solid, "Mean");
text.AppendLine($"Mean={mean:F2}  (blue)");

// Median
double median= ((IEnumerable<double>)histogramData).Median();
plt.AddVerticalLine(median, Color.Orange,  2, ScottPlot.LineStyle.Solid, "Median");
text.AppendLine($"Median={median:F2}  (orange)");

// Benchmark
plt.AddVerticalLine(cagr_bench, Color.Red,  2, ScottPlot.LineStyle.Solid, "Benchmark");
text.AppendLine($"{benchmark}={cagr_bench:F2}  (red)");

var an = plt.AddAnnotation(text.ToString(), Alignment.UpperLeft);
an.MarginX = 20;
an.MarginY = 20;
an.Font.Size = 16;
an.Shadow = false;
an.BackgroundColor = Color.LightBlue;
The latter code snippets go to the "Backtest Complete Code" section:
At this stage the generation of the plot is complete. We save everything to a "PlotSpec" using the File->Save Plot Specs action.
Bravo!!
The InteractiveGraphics extension is designed to work with any Building Block Strategy.
In addition to the stratgy's building blocks a "Canvas" block is added along with sole "Plot" blocks inside the canvas.
For the "#Symbols vs. CAGR" we need no trading strategy building blocks. The complete stratgy consists of the "Canvas" building block and its internal "Plot" block alone:
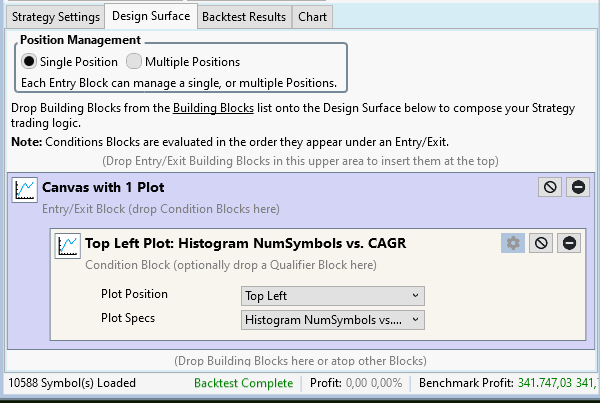
Please note how we selected the PlotSpec generated above in the "Plot" building block.
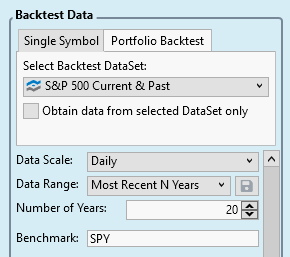
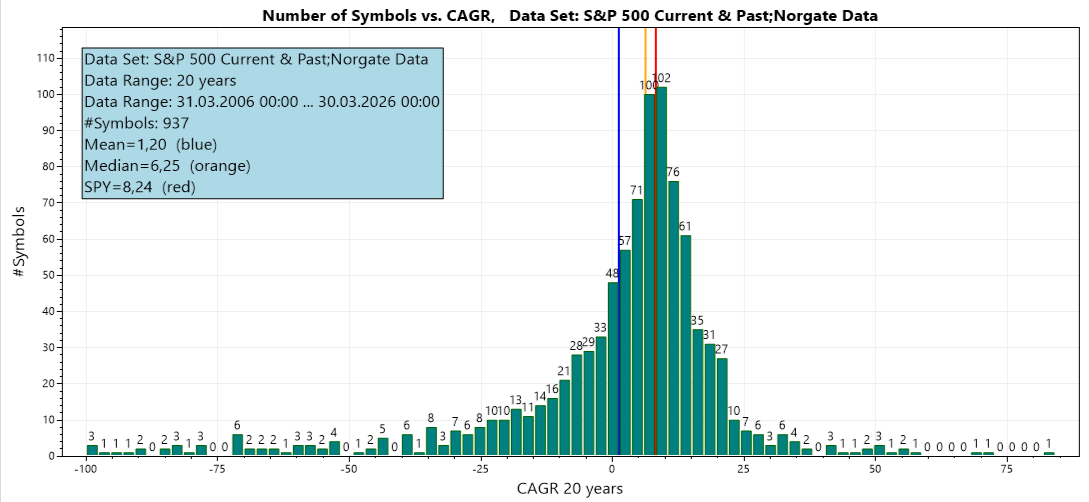
Now everything is in place and we can produce "#Symbols vs. CAGR" plots for arbitrary Data Sets and Data Ranges. As an example I used the S&P 500 and 20 years:
That reults in this beautiful graphic:
In addition to the stratgy's building blocks a "Canvas" block is added along with sole "Plot" blocks inside the canvas.
For the "#Symbols vs. CAGR" we need no trading strategy building blocks. The complete stratgy consists of the "Canvas" building block and its internal "Plot" block alone:
Please note how we selected the PlotSpec generated above in the "Plot" building block.
Now everything is in place and we can produce "#Symbols vs. CAGR" plots for arbitrary Data Sets and Data Ranges. As an example I used the S&P 500 and 20 years:
That reults in this beautiful graphic:
Your Response
Post
Edit Post
Login is required