Is there a functionality to click one area of the chart and another area of the chart and see the difference in values of both the x and y axis?
Rename
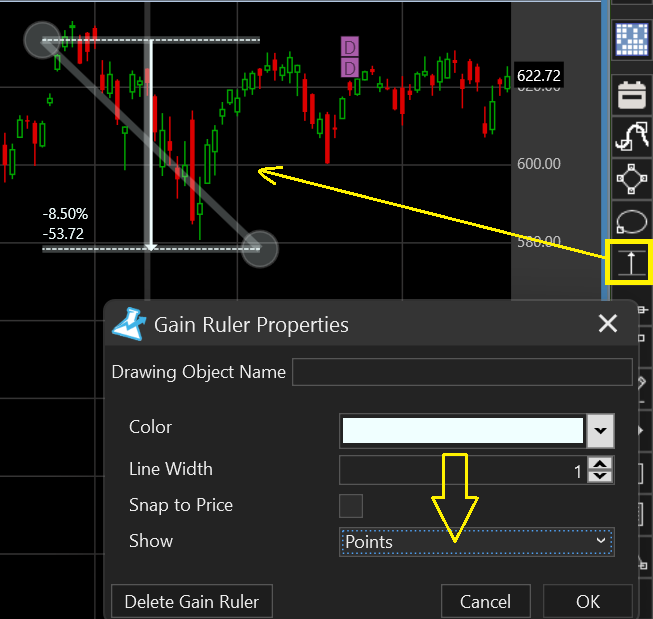
For the y-axis, use the Gain Ruler, showing Points.
For the x-axis, there's a Calendar projection drawing tool that might be useful, otherwise you'll have to point a couple times and subtract the bar numbers shown in the chart status bar (lower left).
For the x-axis, there's a Calendar projection drawing tool that might be useful, otherwise you'll have to point a couple times and subtract the bar numbers shown in the chart status bar (lower left).
This is very useful, thank you! Anyway I can make the tool sticky so I can draw multiple lines without having to reselect the tool every time?
You have to click on a tool each time you want to draw a new one.
Your Response
Post
Edit Post
Login is required