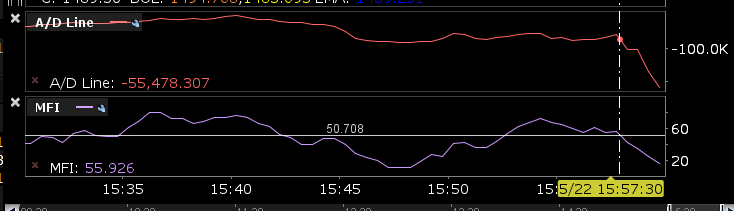
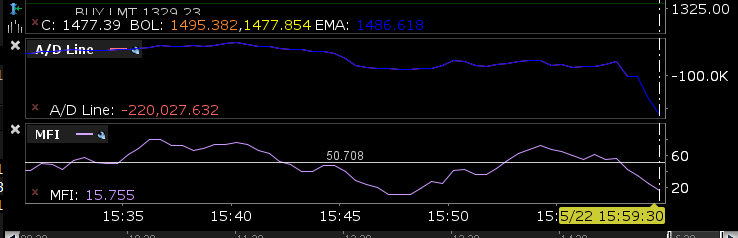
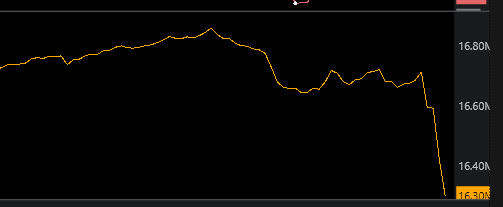
Hello, comparing SNDK 30-second bars 5/22 last trading moments between TWS and WL. TWS A/D drop is about 150K. While WL is from 16.7 M to 16.3M - 400K. Both are the same 30-second bar interval/timeframe. This is just an example, seeing this with other tickers.
Rename
Streaming? Historical?
Did you export the chart data?
Did you export the chart data?
I did it just now with IB Historical and the drop was approx -122465. The calculation is correct (and probably hasn't changed in 25 years).
The difference is in the IB conflated streaming data. It's not a bug. For all ticks and volume for streaming, you'll need a different provider.
Another way is to use IB Streaming Bars in the Strategy Monitor - although you're limited to 1-minute intervals that. Streaming Bars essentially gives you the historical bars so that you don't see issues like this.
Explained:
All About WealthLab Intraday and Realtime Data Providers
The difference is in the IB conflated streaming data. It's not a bug. For all ticks and volume for streaming, you'll need a different provider.
Another way is to use IB Streaming Bars in the Strategy Monitor - although you're limited to 1-minute intervals that. Streaming Bars essentially gives you the historical bars so that you don't see issues like this.
Explained:
All About WealthLab Intraday and Realtime Data Providers
Also, you can play around with these settings, which will affect how volume is reported:
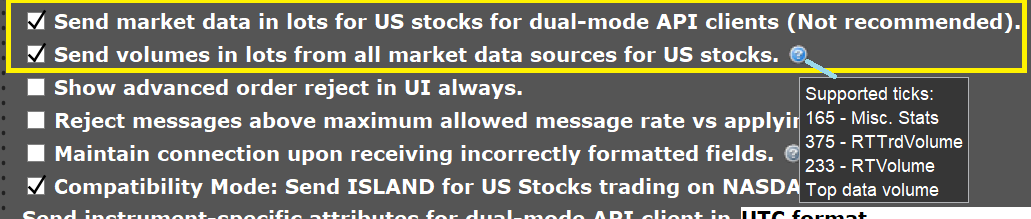
I just noticed that there's an additional selection that wasn't there previously. Compare to image on the Interactive Brokers details page. In fact, since IB is "Not recommending" the old selection for dual-mode API clients, try deselecting it and try with the next one.
I just noticed that there's an additional selection that wasn't there previously. Compare to image on the Interactive Brokers details page. In fact, since IB is "Not recommending" the old selection for dual-mode API clients, try deselecting it and try with the next one.
All historical, taken on Sunday, not stream.
Took screenshot, deleted 1-min SNDK from disk, unchecked the not recommended API setting, restarted WL and reloaded 1-min SNDK (historical). Now it's in the Billions..
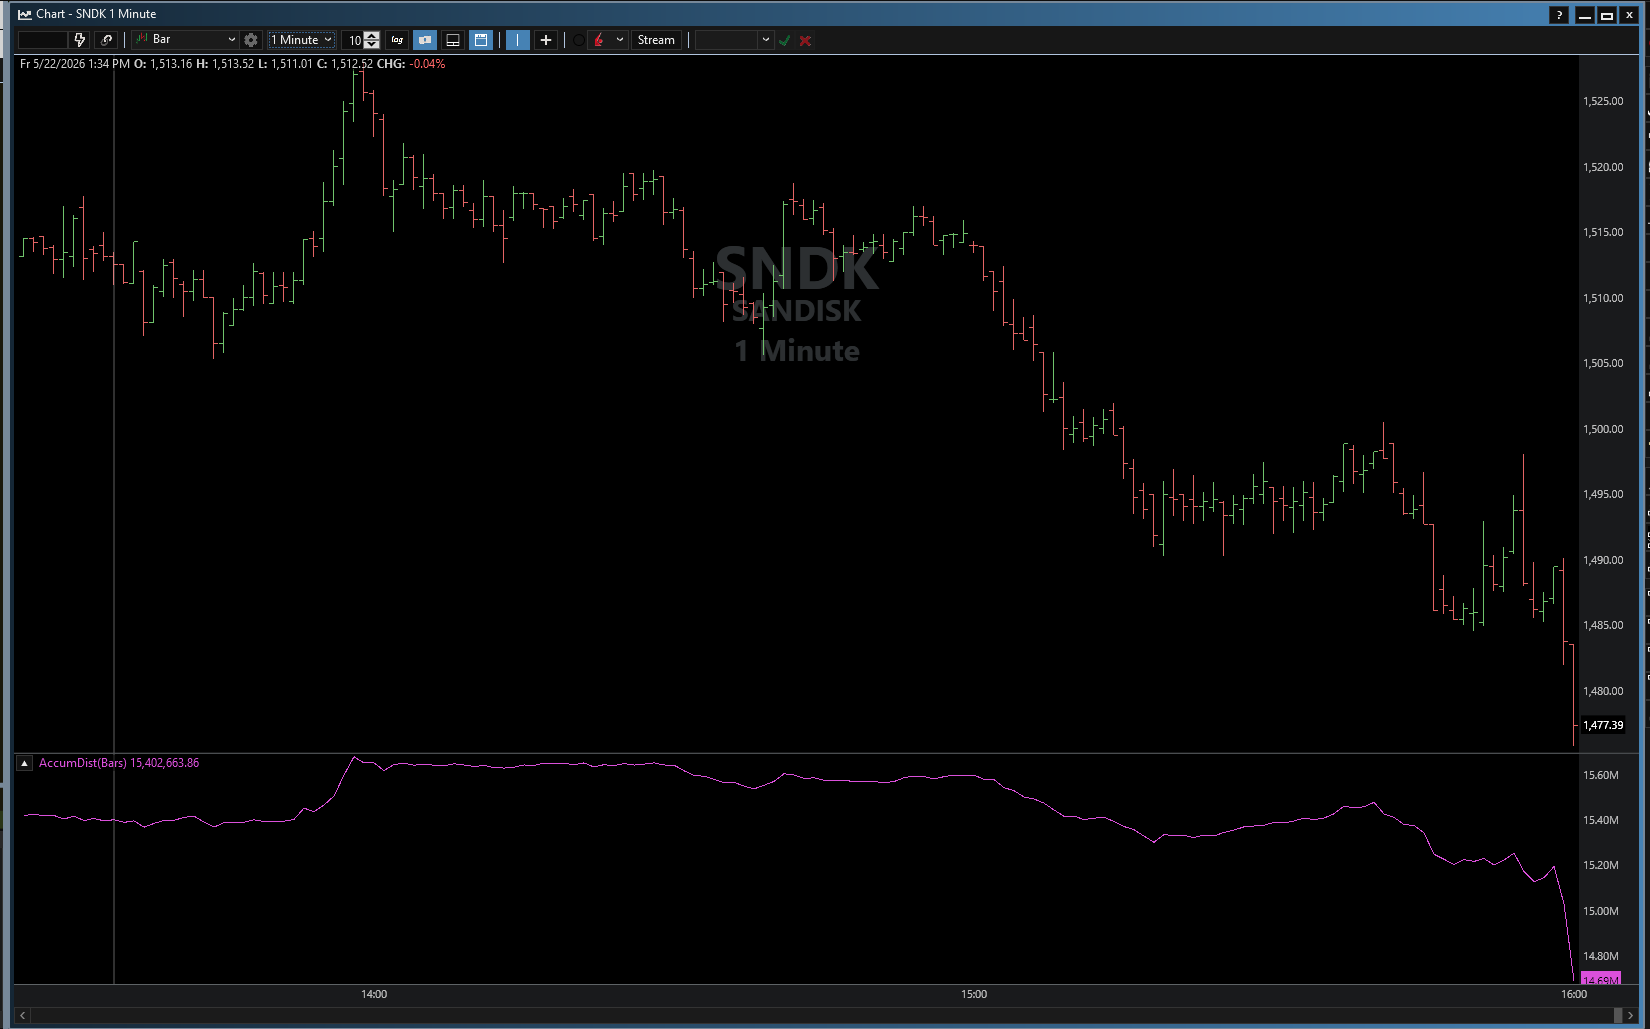
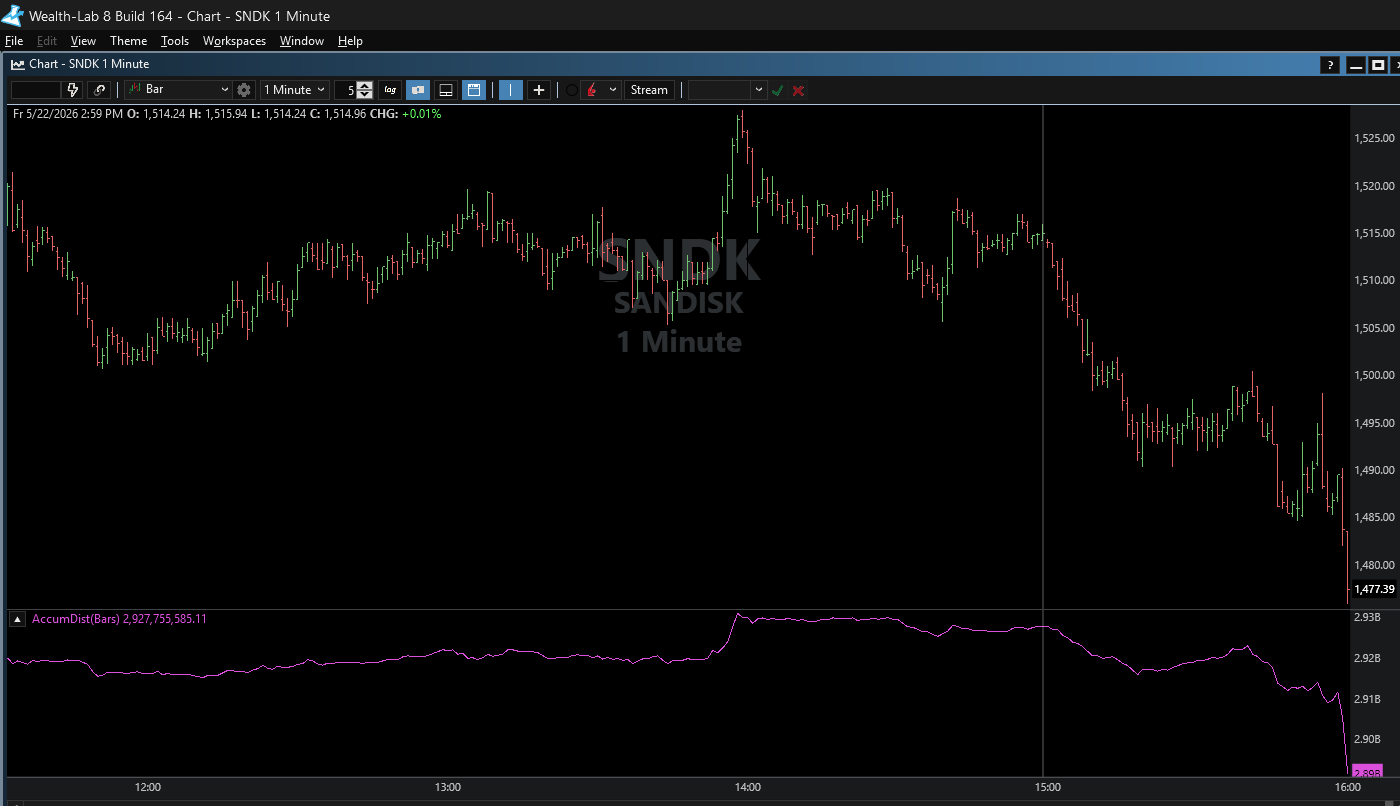
Took screenshot, deleted 1-min SNDK from disk, unchecked the not recommended API setting, restarted WL and reloaded 1-min SNDK (historical). Now it's in the Billions..
Using 3rd party chart, which uses IBAPI, I can see the ~ 150K volume change.
It was 122,465 for me. Change your settings. The Provider has to assume 1 configuration for everyone.
Already changed the "not recommended" API, which resulted in billions. Which setting?
Leave it checked. Those are my settings.
To clarify, that setting was set in the first place. I tried with and without it. Note above.
Either way, the results did not come close to ~ 150K.
Either way, the results did not come close to ~ 150K.
Here is another example - this time, instead of billions, it's in the hundreds of thousands. I changed the data from last 4 years to last 300 bars.
Note in the screenshot above that the scales were in the millions and Billions. I suspect that the length of data (how many bars to fetch) distorts A/D calculation.
The chart below was created as follows:
. Enabled "Set market Data in lots for..."
. Closed WL
. Deleted 1-min SNDK from disk
. Started WL
. F12 > data > last 300 bars
. New chart with A/D
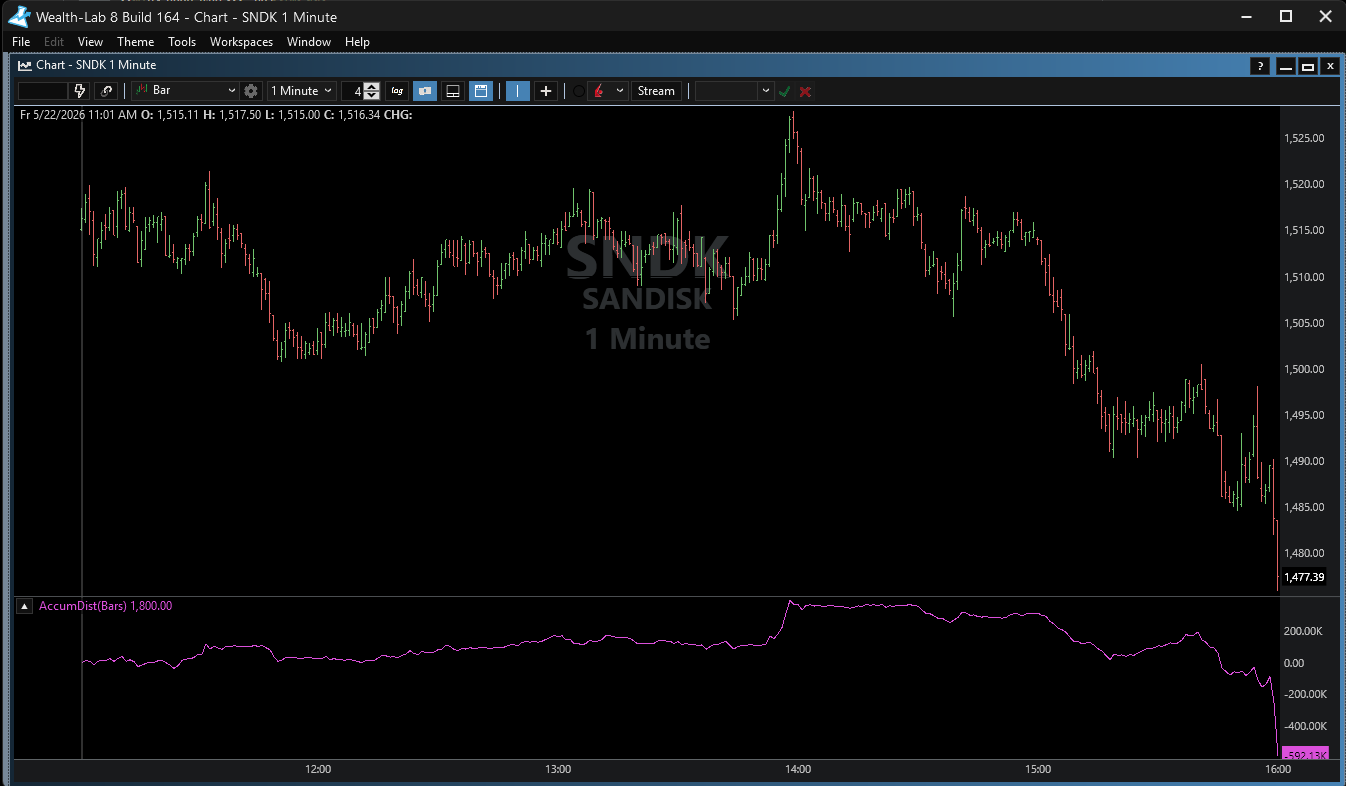
Note in the screenshot above that the scales were in the millions and Billions. I suspect that the length of data (how many bars to fetch) distorts A/D calculation.
The chart below was created as follows:
. Enabled "Set market Data in lots for..."
. Closed WL
. Deleted 1-min SNDK from disk
. Started WL
. F12 > data > last 300 bars
. New chart with A/D
QUOTE:Of course the A/D data is different for 300 bars vs any other range. There is no period parameter. The changes bar-to-bar, however, will be the same.
I suspect that the length of data (how many bars to fetch) distorts A/D calculation.
The calculation is correct and standard. The difference is in the data - the settings affect how volume is received.
I'm not getting the same result as you are, so the difference must be in the settings. Show me a picture of your settings, all of them.
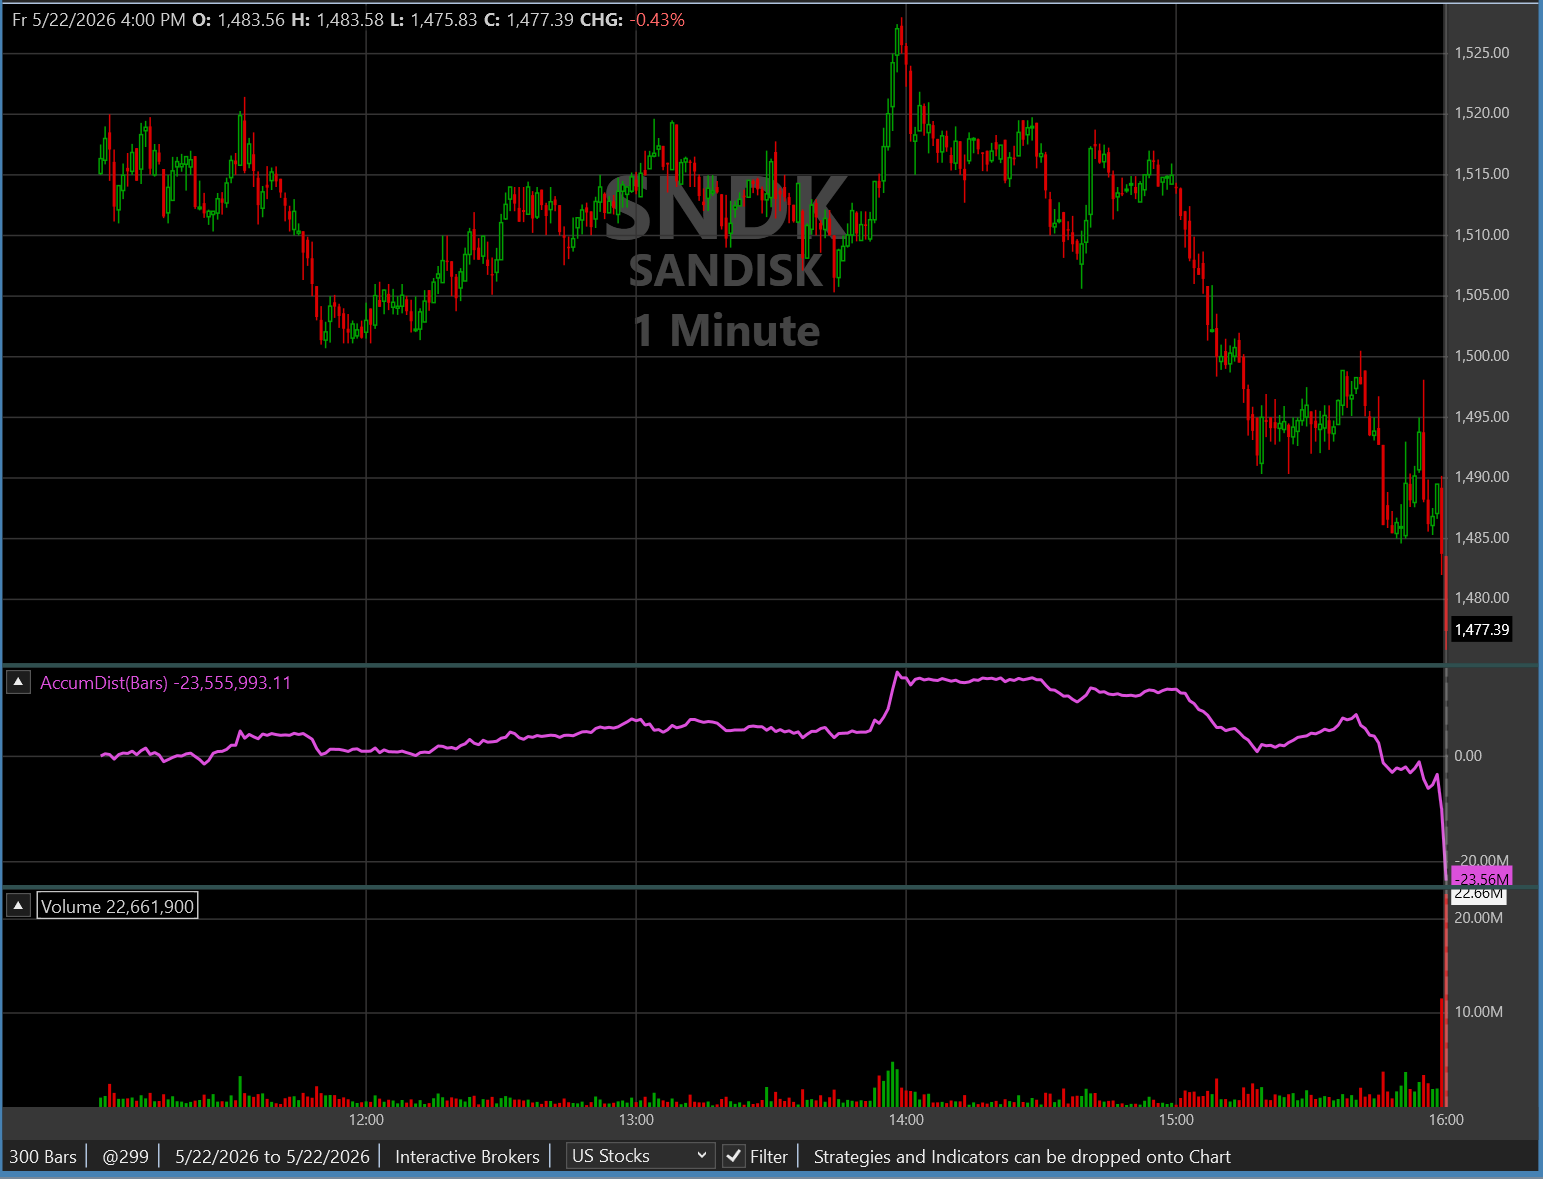
Here's my result of your 300-bar test.
Your Response
Post
Edit Post
Login is required