
finantic.Export
The finantic.Export extension can export a variety of data from Wealth-Lab to external files. It supports three file formats:
- CSV - Comma Separated Values
- Excel - Excel .xlsx files
- Parquet - Apache Parquet file format
It can generate a multitude of different file contents:
- Single TimeSeries (date, values)
- Single Indicator (date, values)
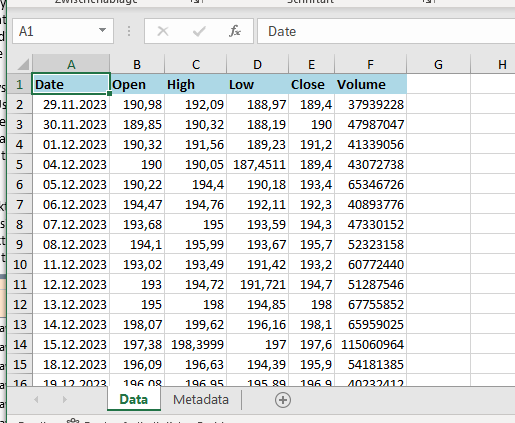
- BarHistory (date, open, high, low, close, volume)
- A collection of TimeSeries/Indicators
- A BarHistory with its named series and a collection of TimeSeries/Indicators
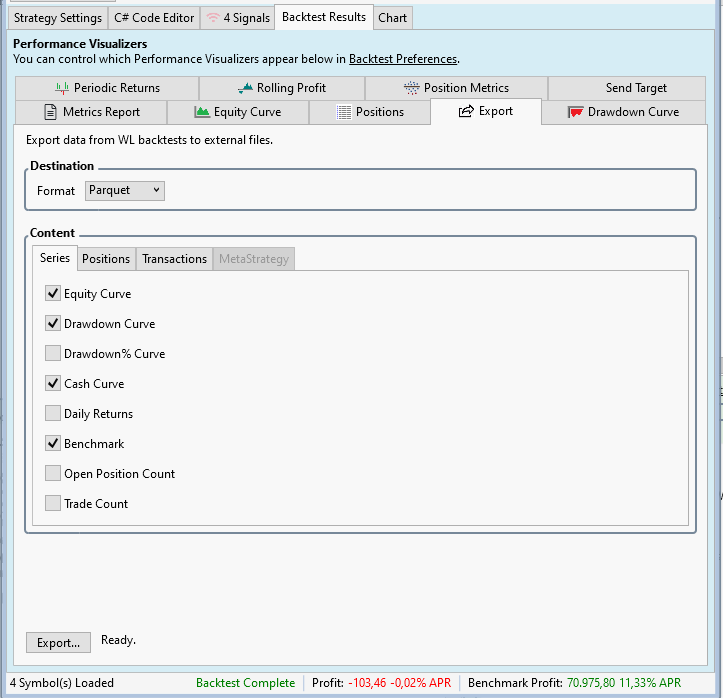
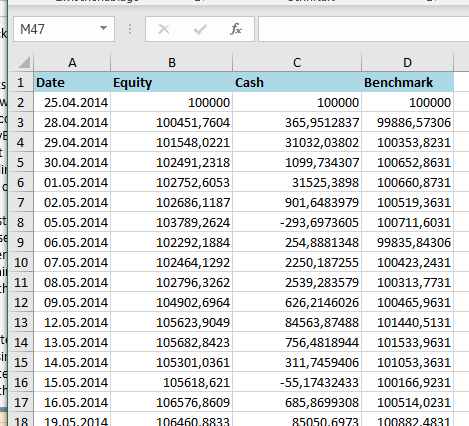
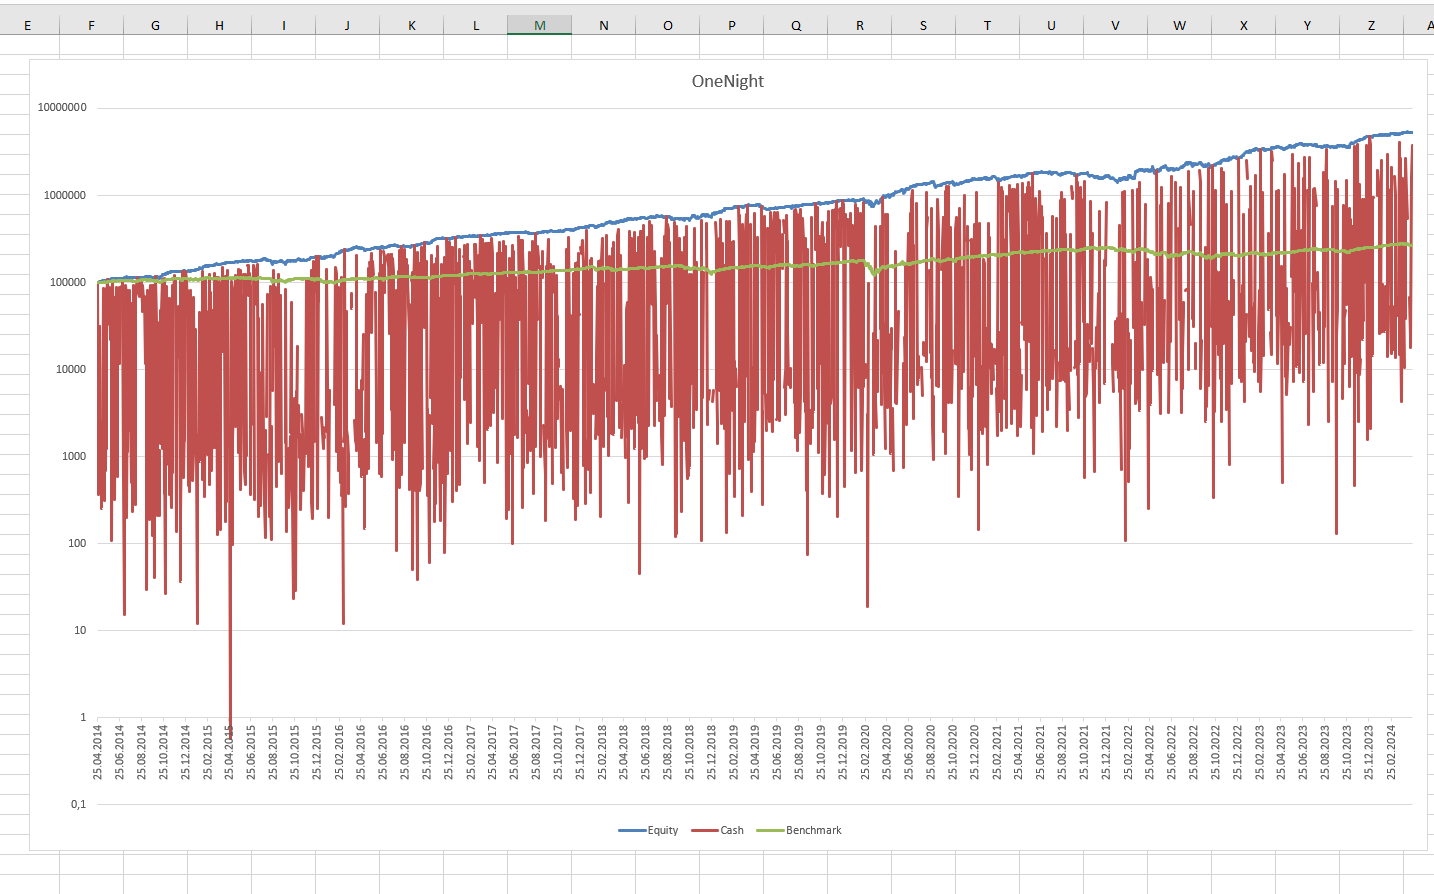
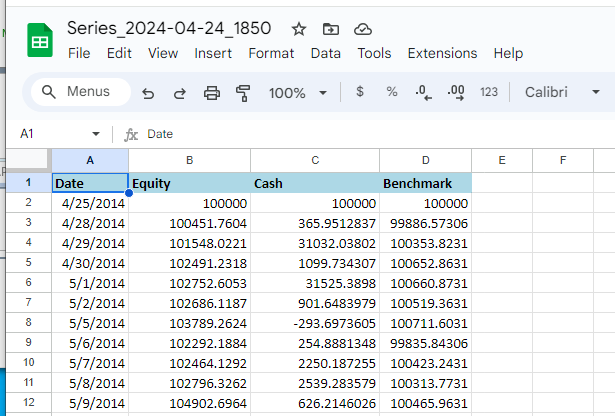
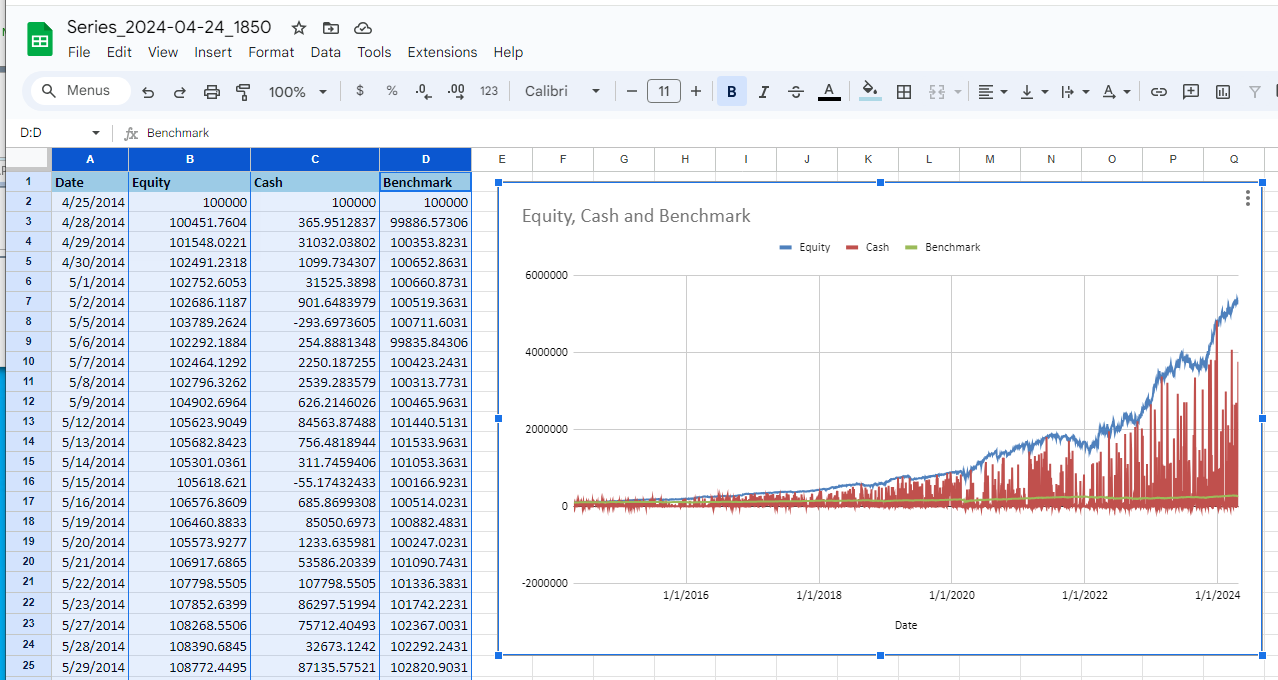
- Series results of a backtest: Equity curve, Drawdown curve, Cash Curve, etc
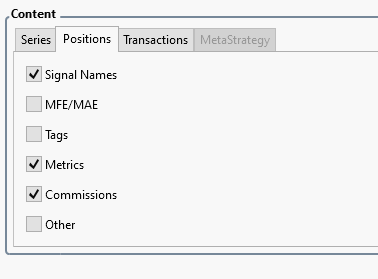
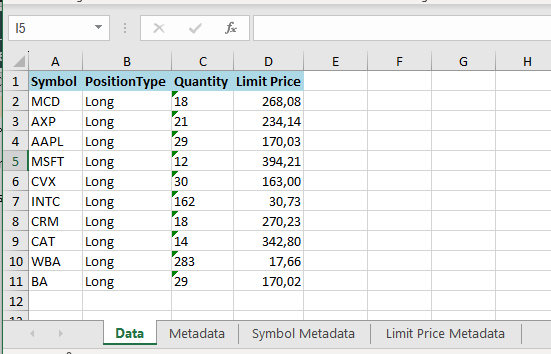
- Positions of a Strategy's backtest
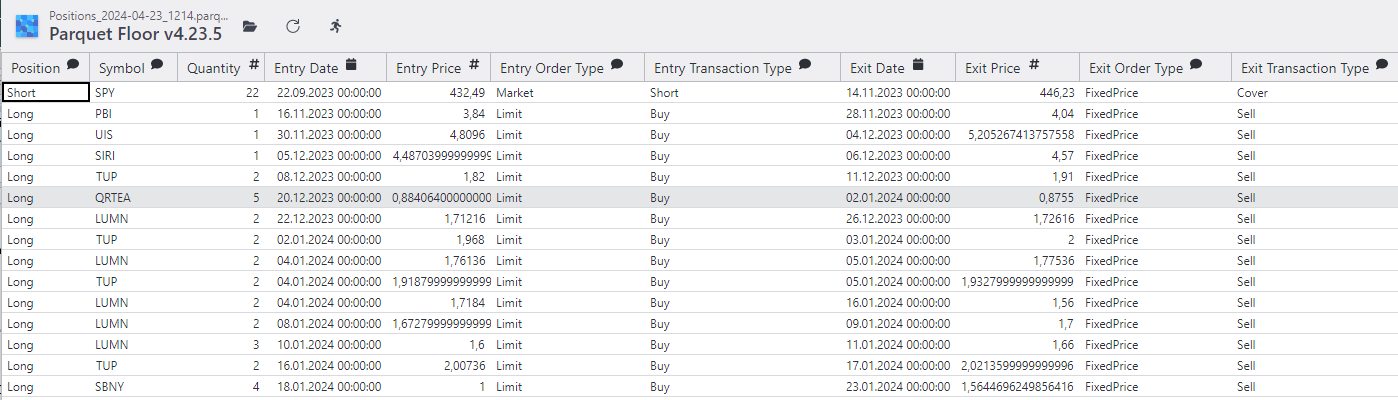
- Transactions if a Strategy's backtest
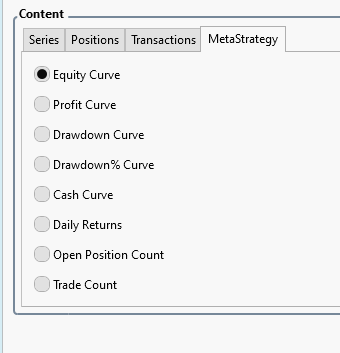
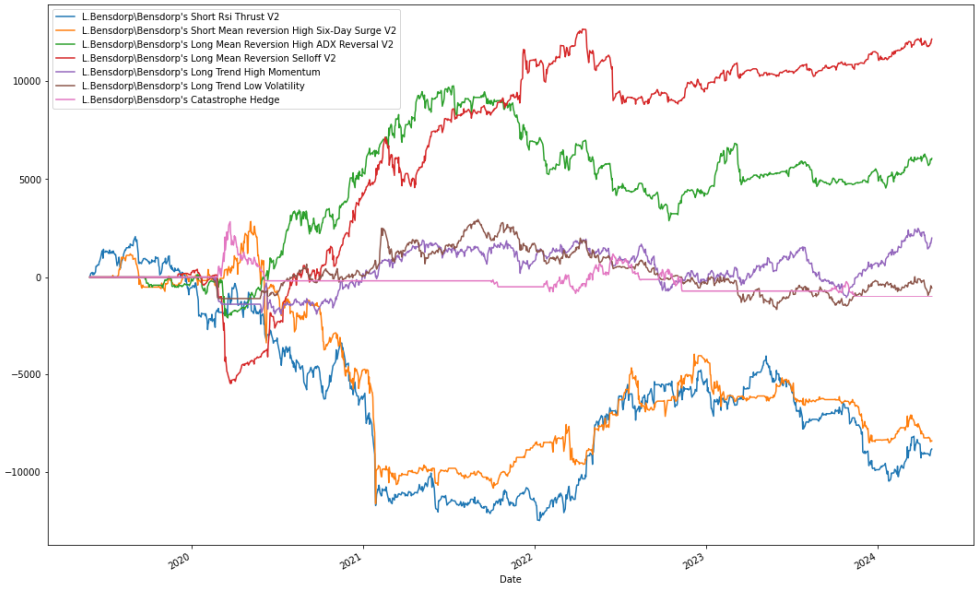
- Collection of series of a MetaStrategy: Equity curves, Profit curves, Drawdown curve, Cash Curve, etc
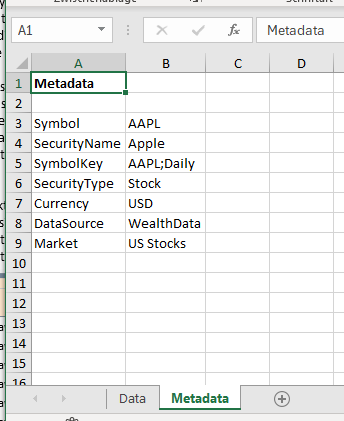
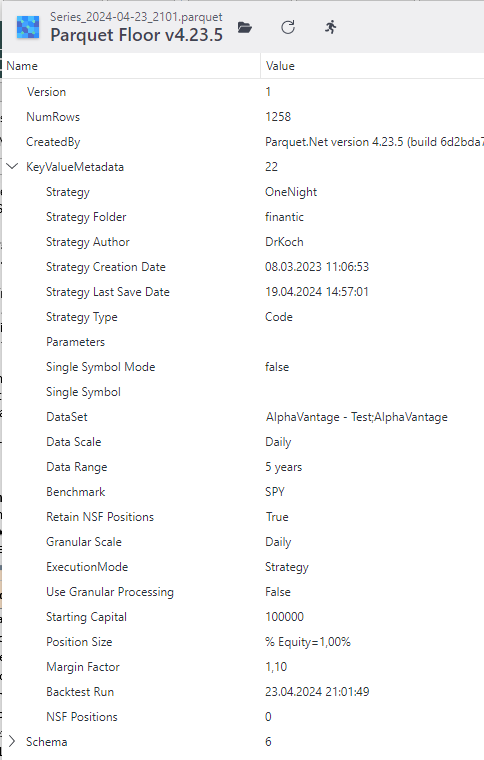
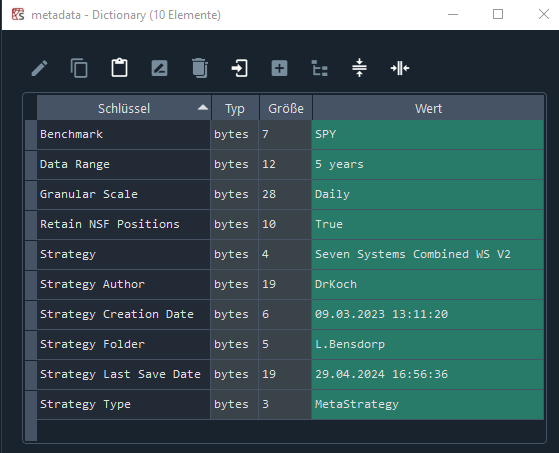
All files contain metadata for both the complete file and individual columns.
(CSV Files contain file metadata only)
CSV - Comma Separated Values
CSV files are understood by virtually every software package that can import data. These files are based on text and thus are human readable. The files are relatively big and require matching configurations on both the producing side and the consuming side. finantic.Export allows to configure all aspects of the CSV format (separator, decimal character, empty field string, etc.)
Excel files
Excel Files will contain several worksheets: Data, File Metadata and Column Metadata.
Parquet Files
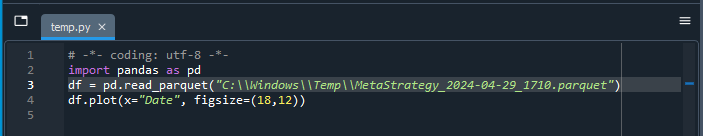
Parquet files are designed for large amounts of data. Parquet files are binary files that support compression and various encodings. This makes parquet files relatively small. No configuration is needed. Parquet files require parquet viewer software to display their contents. Parquet files are understood by a growing set of scientific data processing software:
- Pandas Python data manipulation and analysis library (see https://pandas.pydata.org/docs/reference/api/pandas.read_parquet.html)
- R, with Apache Arrow (see https://r4ds.hadley.nz/arrow)
- Mathlab & Simulink (see https://de.mathworks.com/help/matlab/parquet-files.html)
- Apache Hadoop ecosystem
- AWS Glue (see https://docs.aws.amazon.com/glue/latest/dg/aws-glue-programming-etl-format-parquet-home.html)
- Azure Data Lake
- Amazon S3
Screenshots

Change Log
Initial Release.
- Three File formats: CSV, Excel and Parquet
- TimeSeries, Indicators, BarHistories
- Equity curves, Drawdown curves, Cash curves, etc.
- Metastrategy Results
- Positions, Transactions
- Arbitrary tabular data with metadata