Setting a Perfect Exit for your Trading SystemPublished: 12/5/2021
|
|
A good trader always seeks to limit his risks by getting out of the trade if it moves against him and taking profits off the table. Using a stop loss and profit target in a trading system is a popular technique to accomplish this goal.
PowerPack and Position Metrics
The PowerPack is a growing extension aimed at professional traders with focus on position sizing, risk management and detailed analysis of backtests.
Among its latest addition is the Position Metrics visualizer, and one of its highlights is the Perfect Exit℠ feature. Position Metics lets you plot a metric on the X axis vs. another metric on the Y axis. The Perfect Exit is a preset that plots the MAE % (or MFE %) on Axis X vs. trade's Profit % on Axis Y. Let's see how this knowledge can benefit your trading system.
Unrealized loss of losing trades
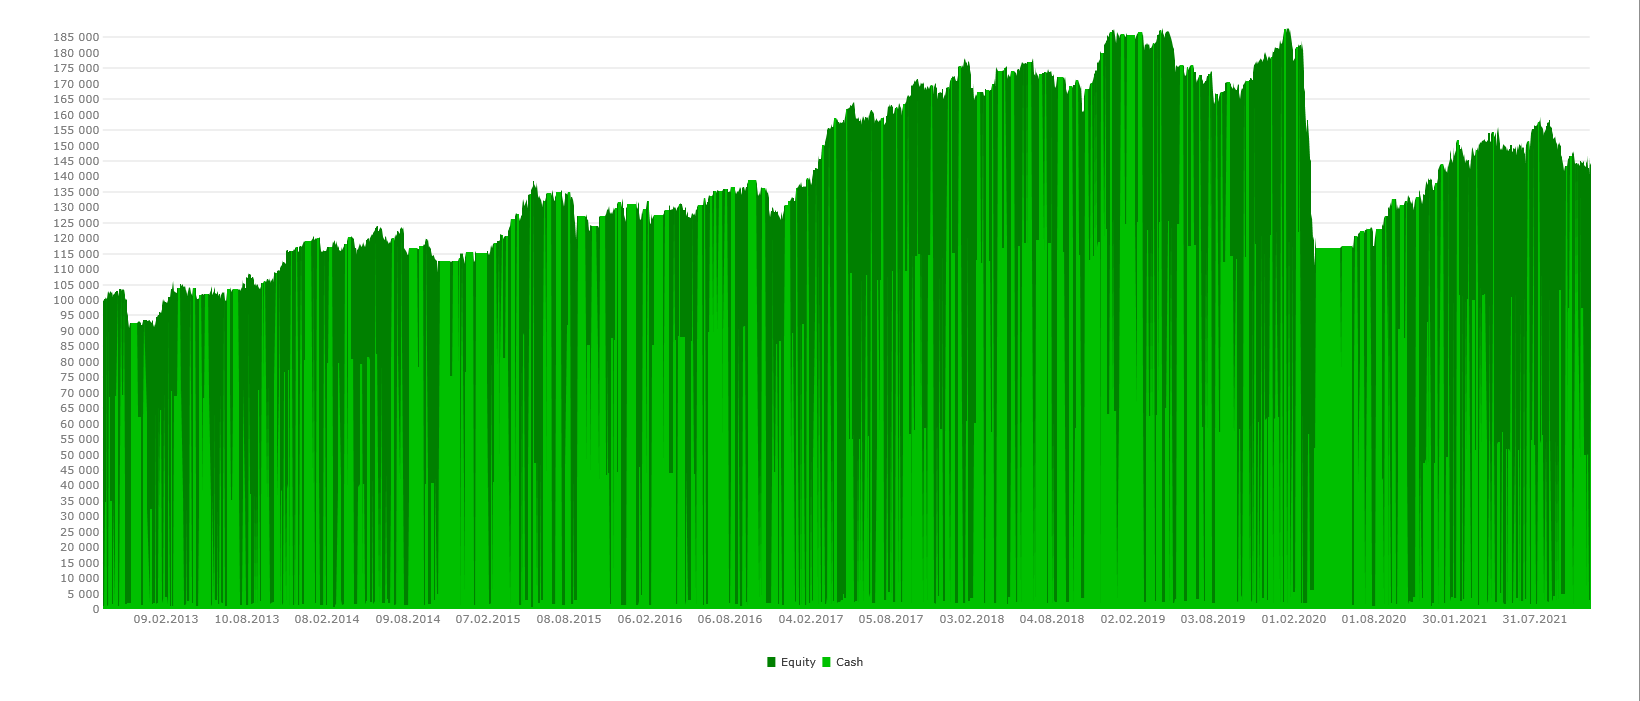
Typically, winning trades have lower drawdowns than losing trades. If we learn how much unrealized loss is incurred by a trade before it ceases to recover with certainty, we can leverage this information to set our stop loss properly. Suppose we have a simple system that lets its losers run and such is the RSI-2 trading model from Larry Connors' book "Short Term Trading Strategies that Work". A backtest of this Blocks based system which is bundled with Wealth-Lab 7 reveals a 43% net profit with a whopping -40% maximum drawdown:
Finding the perfect stop loss level
Enter Perfect Stop Loss℠. To cut the worse losers without sacrificing too many profitable trades which suffered a loss, the visualizer suggests a "near perfect" protective stop as the average percent profit minus a user-chosen number of standard deviations (1 to 3):

After we add a -7% Stop Loss block to the system, its net profit rises to 52% while the maximum drawdown is cut in half to only -23%. Its backtest performance has improved considerably due to curbing the losing trades which is especially noticeable during the Covid-19 crisis:

A perfect profit target
The opposite tactic is possible too. By switching to Perfect Profit Target℠ view (a.k.a. MFE % by Profit%) view you could find better profit targets for your system. Unlike the MAE view, the X axis display the maximum runup of the system (MFE %) and it's the losing trades that now are clustered on the left side because they typically have a lower MFE.
The orange linear regression line is the system's "win diagonal". To capture the greater part of profitable trades with a "perfect" profit target, the visualizer adds a user-selected number of standard deviations (1 to 3) to the average percent profit. Choose it so that the distance to your profit target isn't to placed too closely so as to deteriorate your system's performance.
No Credit Card required.