Avoid Survivorship Bias with Dynamic DataSetsPublished: 11/11/2022
|
|
What is Survivorship Bias?
Let's start with a WWII analogue because it's a quick way for everyone to recognize the "blind spot". In WWII, military commanders decided to add armour plating to aircraft to help them survive in combat. Because armour is heavy, they had to determine the most-effective locations to place it to minimize the additional weight. Studying damaged aircraft that returned from combat, the prevalent thinking was to install armour on the surfaces that typically sustained the most damage. It seemed to make sense until a brilliant analyst realized that this decision was based only on the aircraft that survived instead those that didn't make it back home. In short, armour was required in the all areas of surviving aircraft that statistically had the least damage!
Survivorship Bias in Backtesting
At Wealth-Lab.com the stakes are a little lower - we're all going to make it back home today and we're concerned only with avoiding survivorship bias in backtesting. (Okay, you probably have bigger things to worry about, but just play along.)
Like the aircraft that make it back to base, companies that are listed on the Nasdaq or NYSE, and more specifically, those that are constituents in a major index are the survivors. Bankrupt companies and others that are no longer publicly-traded or that were simply removed as an index component are the ones that "didn't make it". The odds favor that these companies are lurking in your backtesting blind spot.
It's good to point out that all companies that "die" in the ways just mentioned don't have a fatal ending. Many are even risen to new heights through M&A (merger and acquisition) activity in their final weeks or months of public trading.
Suffice to say, all of the companies currently included in the NASDAQ 100, S&P 500, or [insert your favorite index here] are not the same companies that comprised the index last year or 20 years ago. When you backtest with the current index components that you find in your financial news, you're testing only the survivors, and your backtesting results will be "biased" toward those companies.
Wealth-Data and Wealth-Data DataSets
Now is a good time to mention a special group of DataSets created for WealthLab - the Wealth-Data DataSets. Wealth-Data is end-of-day data (daily bars) that generally covers the symbols in the Nasdaq 100, S&P 500, and German DAX indices. Go to Wealth-Data.com to find out how Wealth-Data is different from other end-of-day data.
Wealth-Data includes all of the listed and delisted symbols for the respective index back to about 1995. This gives Wealth-Lab the ability to feed your strategies the symbols (and their data) that were in the index at the time they appeared in the index, historically. The big thing is to remember is that when you use a Wealth-Data DataSet for backtesting you get a survivorship-free backtest without making any edits to your code. And best of all, Wealth-Data is included with your WealthLab subscription!
Important!
When performing a portfolio backtest with a Wealth-Data DataSet, Wealth-Lab's backtest engine automatically exits backtest positions on the day the companies are removed from the index.
Example of Survivorship Bias in a Backtest
There's no better way to understand the impact of Survivorship Bias than analyzing a real example. First, we'll run a backtest of the strategy using the current Nasdaq 100 components and the repeat the test using the Wealth-Data dynamic DataSet.
Strategy Rules
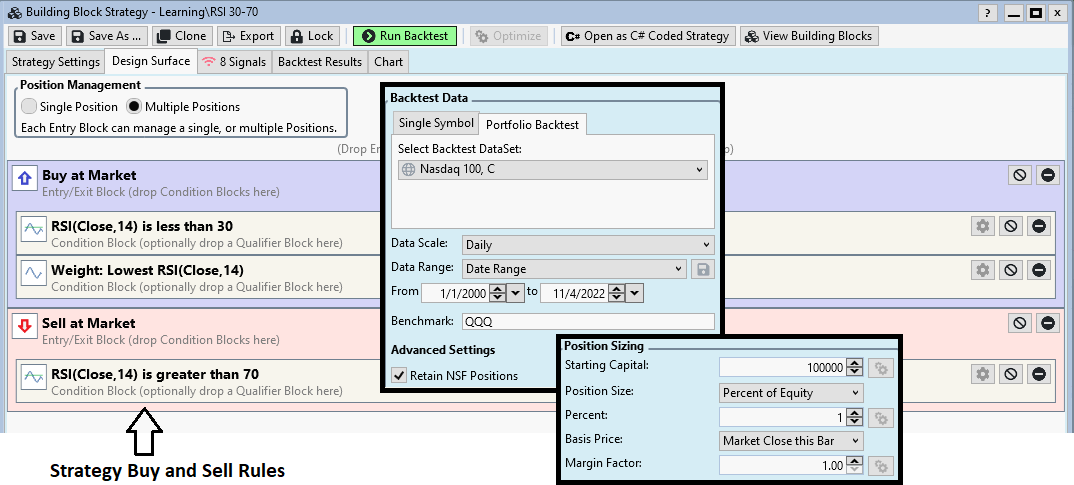
Our simple 1-indicator test strategy buys a 1% of equity position each day the 14-period RSI is below 30. The strategy can add multiple positions for each symbol whenever its RSI is below 30. All positions for a symbol are sold when its RSI-14 goes above 70.
The Strategy and Backtest Settings are shown in the image below.
- Data Range: 1/1/2000 to 11/4/2022
- Benchmark symbol: QQQ
- Starting Capital: $100,000
- Position Sizing: 1% of equity
- Margin: 1:1
Note: In WealthLab Preferences (F12) > Data, all options were deselected (no commissions, no dividends, etc.) for our backtests.
Today, the "Nasdaq 100, C" DataSet has the following symbols:
AAPL ABNB ADBE ADI ADP ADSK AEP ALGN AMAT AMD AMGN AMZN ANSS ASML ATVI AVGO AZN BIDU BIIB BKNG
CDNS CEG CHTR CMCSA COST CPRT CRWD CSCO CSX CTAS CTSH DDOG DLTR DOCU DXCM EA EBAY EXC FAST FISV
FTNT GILD GOOGL HON IDXX ILMN INTC INTU ISRG JD KDP KHC KLAC LCID LRCX LULU MAR MCHP MDLZ MELI
META MNST MRNA MRVL MSFT MTCH MU NFLX NTES NVDA NXPI ODFL OKTA ORLY PANW PAYX PCAR PDD PEP PYPL
QCOM REGN ROST SBUX SGEN SIRI SNPS SPLK SWKS TEAM TMUS TSLA TXN VRSK VRSN VRTX WBA WDAY XEL ZM ZS
Note!
Officially, GOOG is also included in the Nasdaq 100. However, since tracking stocks for the same company tend to be highly correlated, a trading system is likely to simultaneously trigger trades for each trading class, essentially doubling the bet for the same company. For this reason, Wealth-Data includes only one stock per company - now and historically.
Note about "Linked" or "Unlinked" DataSets in WealthLab
- Linked means that the DataSet is linked/assigned to a preferred Data Provider. WealthLab always looks for data from a DataSet's linked provider first.
- Unlinked means that no provider is preferred to return data. Unlinked DataSets are identified in the DataSet tree with a globe icon:

When a DataSet is unlinked, WealthLab requests data from any provider that is checked in the Data Manager's Historical Providers tab in the order of precedence. As shown in the image, WealthData is the first choice following by Interactive Brokers, IQFeed, and so on. If Wealth-Data wasn't able to return data that is current, Alpaca and Q-Data would be skipped because they're not checked.
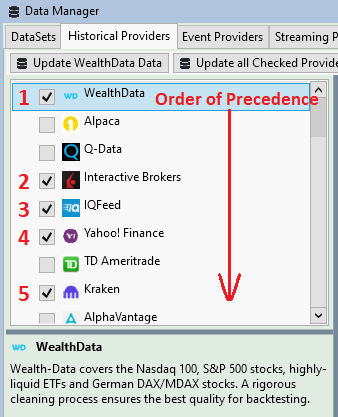
My current "Nasdaq 100, C" DataSet (see Backtest Settings in the first image) is unlinked so that Data can be pulled from any provider in the order of precedence in the Data Manager's Historical Providers tab. Since we're comparing the results with the Wealth-Data dynamic DataSet, we made sure that Wealth-Data is checked and at the top of the provider list so that the data retrieved for the current symbols is the same in both tests.
Get stable, non-changing backtest results
Since we're testing with 100 symbols in the Nasdaq, you can imagine periods during the backtest when a large number of symbols have an RSI-14 below 30 for an extended period of time. For example, assume the strategy is holding 65 positions in 50 symbols, each having about 1% of equity, and, all 50 of the symbols have an RSI below 30. If the strategy triggers 50 buys for the next bar without any exits, enough buying power will exist for only 35 new positions. How does WealthLab determine which 35 are added to the backtest? The answer is Transaction Weight.
Transaction Weight is a number that you can assign to any signal, but if you don't, WealthLab assigns a random number. WealthLab processes trade entries in order of the highest to lowest Transaction Weight. This way, trades with a greater weight have access to buying power first. In the strategy above, notice that I've added a Transaction Weight rule, which uses the Lowest RSI value for the highest signal priority. Consequently, the 35 new positions will be the ones that have the lowest RSI value.
In practice, a trader would sort their signals by the Transaction Weight value, and place the ones with the highest (or least negative) number until all the buying power was consumed. The remaining signals are discarded, just as in the backtest.
Backtest Results - Survivorship Bias
Testing with the "dumb" Nasdaq 100 Data generated an 1,438% profit, or 12.75% annualized. The Equity Curve handily beats buying and holding the QQQ benchmark, whose equity curve is represented by the black line.
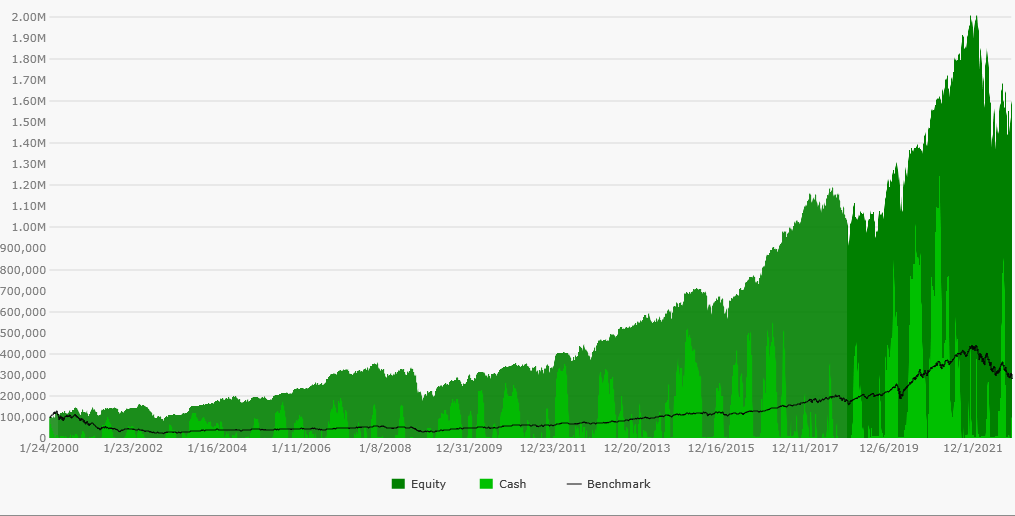
As you're about see, it's not necessary to get into the details of the position profit statistics to show the difference with and without survivorship bias, but it is interesting to note that the NSF Position Count - the number of positions that were rejected from the backtest due to Not Sufficient Funds - was 8,945, while the total count of positions actually used in the backtest was 4,509. Removing the Transaction Weight rule from the strategy would give a lot of room for variability in the results.
Backtest Results - No Bias Wealth-Data
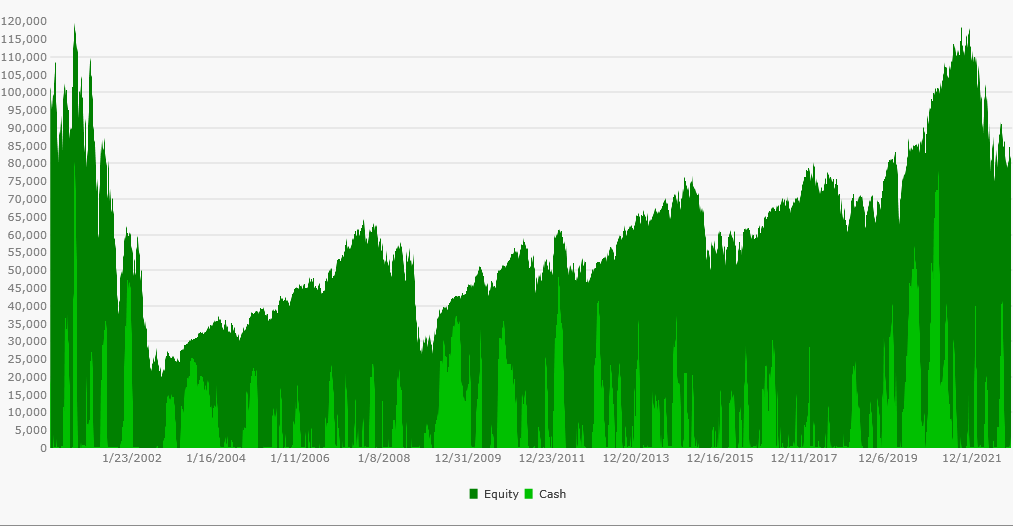
Now contrast the equity curve above with the next one below representing the backtest using dynamic Wealth-Data Nasdaq 100 DataSet. It's not obvious at first glance, but the black line is the same QQQ benchmark equity curve. In this non-biased backtest of the same index the strategy actually lost -17.19% during the approximately 22-year test period.
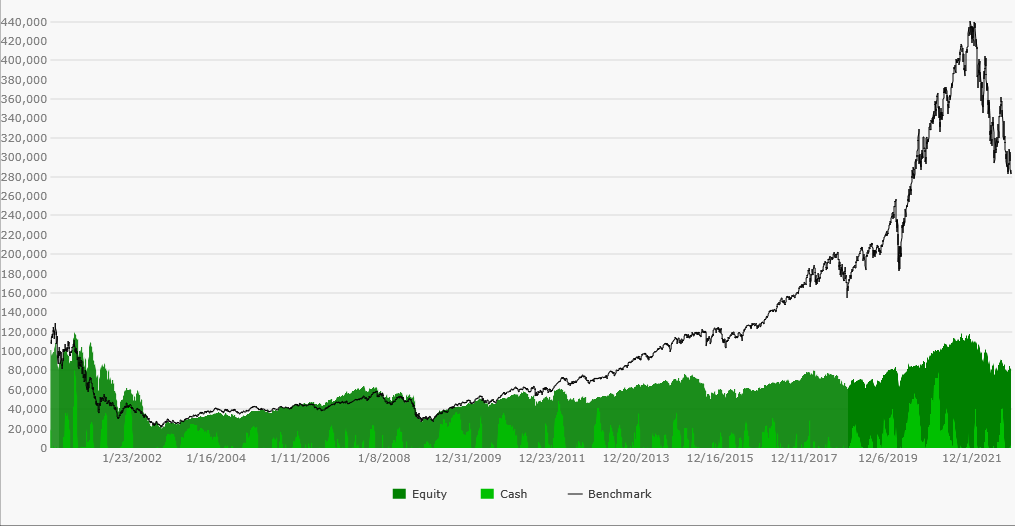
While this backtest without survivorship bias had a similar number of backtest positions (4,991), the number of [NSF] positions rejected from the backtest was nearly double at 15,518. That statistic is indicative that the delisted symbols included in the test had a lower RSI in general. Note that instruments with a strong bullish trend rarely have periods with a 14-period RSI below 35.
The equity curve of the non-biased backtest is repeated below without the benchmark distortion to highlight its poor performance over the test period. Not to belabor the point, but had you actually followed the strategy by trading the Nasdaq 100 during the last 22 years, your portfolio equity would have looked like this next graph...
Delisted Symbols
Although I promised not to talk about specific positions, I wanted show you what delisted symbols look like in Wealth-Data. The table below shows the first 19 positions in the "smart" backtest. When a symbol is delisted, we add the last date traded to its Wealth-Data symbol along with a fate code. Only three of the symbols shown below are still trading and only one of those (SNPS) is still in the Nasdaq 100. Without Wealth-Data DataSets, are you really backtesting?
| Position | Symbol | Quantity | Entry Date | Entry Price | Exit Date | Exit Price | Profit | Profit % | Bars Held |
|---|---|---|---|---|---|---|---|---|---|
| Long | EYE.20050527.A | 33 | 1/25/2000 | 29.75 | 6/15/2000 | 27 | -90.75 | -9.243697479 | 99 |
| Long | LGTO.20031020.A | 35 | 1/25/2000 | 28.625 | 9/6/2000 | 15.2188 | -469.217 | -46.83388646 | 156 |
| Long | BMC.20130910.P | 22 | 1/25/2000 | 45.0625 | 8/29/2000 | 28.75 | -358.875 | -36.19972261 | 151 |
| Long | CE.20040226.A | 103 | 1/25/2000 | 9.875 | 9/1/2000 | 16.3125 | 663.0625 | 65.18987342 | 154 |
| Long | SSCCQ.20100630.C | 50 | 1/25/2000 | 19.75 | 12/28/2000 | 15.5625 | -209.375 | -21.20253165 | 235 |
| Long | SNPS | 37 | 1/25/2000 | 26.625 | 6/5/2000 | 25.625 | -37 | -3.755868545 | 91 |
| Long | BBBY | 75 | 1/25/2000 | 13.5312 | 3/31/2000 | 20.75 | 541.41 | 53.34929644 | 47 |
| Long | AABA.20191002.A | 45 | 1/25/2000 | 22.28495762 | 11/15/2001 | 2.02949858 | -911.4956568 | -90.89296639 | 454 |
| Long | WCOEQ.20040420.C | 25 | 1/25/2000 | 40.2327 | 1/19/2001 | 22.5183 | -442.86 | -44.02985631 | 249 |
| Long | EA | 56 | 1/25/2000 | 18.3281 | 8/28/2000 | 25.2345 | 386.7584 | 37.6820 | 2923 |
| Long | PHS.20051220.A | 46 | 1/25/2000 | 21.75 | 4/13/2000 | 28.0625 | 290.375 | 29.02298851 | 56 |
| Long | EYE.20050527.A | 36 | 1/26/2000 | 27.0625 | 6/15/2000 | 27 | -2.25 | -0.230946882 | 98 |
| Long | LGTO.20031020.A | 36 | 1/26/2000 | 26.625 | 9/6/2000 | 15.2188 | -410.6232 | -42.84018779 | 155 |
| Long | BMC.20130910.P | 22 | 1/26/2000 | 40.625 | 8/29/2000 | 28.75 | -261.25 | -29.23076923 | 150 |
| Long | SSCCQ.20100630.C | 51 | 1/26/2000 | 19.375 | 12/28/2000 | 15.5625 | -194.4375 | -19.67741935 | 234 |
| Long | SNPS | 41 | 1/26/2000 | 23.8125 | 6/5/2000 | 25.625 | 74.3125 | 7.611548556 | 90 |
| Long | CPWR.20141215.P | 46 | 1/26/2000 | 21.9668 | 9/1/2000 | 10.5633 | -524.561 | -51.91243149 | 153 |
| Long | PHS.20051220.A | 48 | 1/26/2000 | 20.375 | 4/13/2000 | 28.0625 | 369 | 37.73006135 | 55 |
| Long | EYE.20050527.A | 37 | 1/27/2000 | 26.25 | 6/15/2000 | 27 | 27.75 | 2.857142857 | 97 |
Conclusion - See the Blind Spots!
When developing trading systems, we have to be careful of blind spots in backtesting. Some big ones to be mindful of include:
Survivorship Bias
As we've seen, Survivorship Bias involves backtesting current index components with non-dynamic DataSets. If you're developing end-of-day stock trading systems, there's absolutely no excuse not to use Wealth-Data dynamic DatSets in a final analysis!Peeking
A trading system that "peeks" uses future data or events for trading decisions during a backtest. WealthLab Version 8 makes it very difficult for trading strategies to peek using trading signals. It can be done, but you need to make a good programming effort to make it happen. The most common peeking mistake is using a trading rule that filters stocks above or below a specific price. Since historical data are split based on future corporate events (splits, special dividends, etc.), a price filter rule should use WealthLab's SplitRev indicator in order to test using the actual stock prices at the time of trading.Over Optimization
Over optimizing involves finding a set of parameter values that work very well [only] with the in-sample test data. Optimizing is a complicated topic - we'll save that discussion for another day!
No Credit Card required.