I am suggesting/requesting an improvement to the Performance+ Visualizer.
I noticed that I seemed to have excessive Outliers in some of my strategies, over 47%. How could that be, I wondered? So I did some analysis. Following the WLP Wiki, I found the definition..
QUOTE:
A trade is considered to be an outlier if it's profit/loss is greater than three standard deviations away from the average.
Then the question - average what? - dollars or percent. In the case of the Performance+ Visualizer, it's using standard deviation of trade
dollars. This leads to a problem for a 10-year backtest, because the trades get larger and larger. My trade size is 10% of portfolio value. Trades near the start of the backtest will never be seen as outliers because relatively few dollars are traded. At the start of the backtest, trade size is near $10,000, but by the end of the backtest, trade size is over $480,000. So, a 1% gain at the end of the backtest is $4,800. $4,800 would be a 48% gain at the start of the backtest. The 48% is the more likely outlier.
So, my suggestion. Add a second Outlier report, based on percentages rather than dollars. Rather than the top line being "Standard Deviation of Profits", it could be "Standard Deviation of Profit Percent". The same five reporting rows could follow, except based on outliers chosen by percent.
Size:
Color:
Outliers based on percentages (like in Trade Graphs | Trade Stability) make sense. Task has been added to the product backlog. Thank you Leonard.
Size:
Color:
If I could "Like" a post, I would Like++ this one. Good suggestion, Leonard!
Size:
Color:
Thank you Eugene and Dartboard Trader.
When I worked the numbers in a spreadsheet, the 47% outlier percent was reduced to 14% by using the percent method.
A more difficult problem is quantifying the effect of outliers. I say this because large outliers near the start of the backtest provide funds to invest that are amplified as the backtest proceeds. (don't know if this typical, but, in my strategies, positive outliers under both methods exceed negative outliers by ~10 to 1),
Size:
Color:
Thanks for articulating the problem so clearly.
Isn't this 'std dev of profits' calculation also used in the denominator of the formula for the Sharpe ratio?
Size:
Color:
Actually, I think the Sharpe ratio uses 'standard deviation of monthly returns' in its calculation and not 'standard deviation of profits' per trade as is being discussed above.
Size:
Color:
Will be added in the extension's upcoming release 2014.03.
Size:
Color:
Size:
Color:
Thanks ... but ....
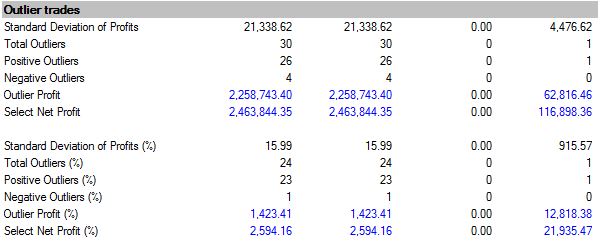
"Outlier Profit (%)" and "Select Net Profit (%)" seem way too small. How are they calculated?
My results are similarly suspicious...
Size:
Color:
They are not small: these numbers are percent-based. The only change to the formula is that instead of taking raw dollar values as before with NetProfit, the formulas are using NetProfitPercent. This is why the % sign can be noticed attached to every such metric.
For example, clicking on "Outlier Profit (%)" suggests that this is "Percentage-based profit (loss) created by positive and negative outlier trades together." This means that the formula sums up the Profit % values for outlier trades, which is a trade that exceeds the Average Profit % by -3 Standard Deviations.
Size:
Color:
Ok, I see that, but that wasn't my intent. My intent was to be able to compare outlier
dollars for trades chosen by percent against (the original) outlier dollars for trades chosen by dollars. From Post #1...
QUOTE:
So, my suggestion. Add a second Outlier report, based on percentages rather than dollars. Rather than the top line being "Standard Deviation of Profits", it could be "Standard Deviation of Profit Percent". The same five reporting rows could follow, except based on outliers chosen by percent.
I guess I should have emphasized "same five reporting rows" more strongly.
BTW, the Buy-and-Hold (rightmost) column looks like what I expected. I'm sort of guessing it's still calculated on dollars.
Size:
Color:
No, all numbers on these rows including B&H are not calculated as dollars. I see what you mean but such modification would go beyond the quick help I intended to provide.
Size:
Color:
QUOTE:
No, all numbers on these rows including B&H are not calculated as dollars.
Really? Then, this report tells me that my strategy is pretty worthless, since (numbers from post #9) the sum of its Outlier plus Select Profit Percent is a mere 4,400%, while Buy-And-Hold summed Profit Percent is more than 34,700%. The former fairly matches the "Performance Visualizer", while the latter doesn't. B&H "Net Profit %" in the "Performance Visualizer" is 179.71%. Also, the report for my backtest shows
B&H "Standard Deviation of Profits (%)" to be 915.57%, seems off by an order of magnitude. I'd kindly ask that you again check the calculations.
From my Post#1
QUOTE:
The same five reporting rows could follow, except based on outliers chosen by percent.
My request was that your quick help be even quicker and simpler. Simply choose the outlier trades based on percent and make no change to the calculations.
If you like what you coded, then could you add two more lines to the report, and put the units with quantities, not just in the labels?
Specifically, using my example, the last four lines I would like should be:
CODE:
Please log in to see this code.
Notice the change in labeling as well please [Ex. "Outlier % Profit" rather then "Outlier Profit (%)"].
Size:
Color:
Hi Leonard,
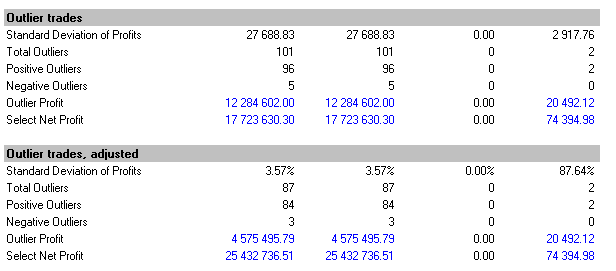
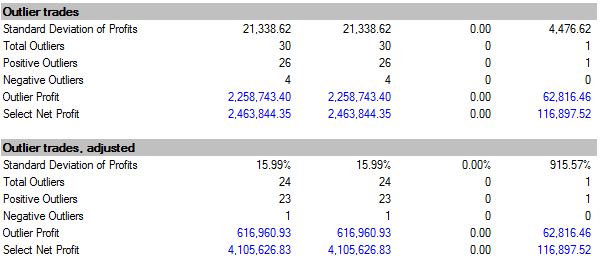
Thanks for the feedback. The B&H numbers are not off and there's nothing to correct. As to displaying the percentage-adjusted outlier profit as dollars, I see your point. Previous version was counterintuitive so I've made the change you requested in v2014.03.1:
Size:
Color:
Eugene,
Excellent!!!! I've attached my results which parallel post #9.
The only cosmetic change I would consider is in labeling. For clarity, I would suggest changing
", adjusted" to
", by %" to more clearly indicate the difference between the two reports.
Thanks for following up with the quick release
One last thing. While implementing suggestions of mine, if you would like me to review anything, or simply echo back what you heard as the requirement, just send me an email. I will be responsive (posting in these forums, less so). It is far less effort to fix a problem in the design phase than after coding has started.
Len
Size:
Color:
Please add "Select Net Profit, Adjusted" to the Scorecard so it can be an optimization metric. This is the new one using percentage as the basis for identifying outliers.
Len
Size:
Color:
Will do in next release (April'15).
Size:
Color: